Life & fun · alternatives · 2026

24 alternatives to A collection of visualizations for IPython
Use web data visualizations in IPython notebook
Below are 24 products that do a similar job, ranked by how close each is in meaning and then by launch-day votes. A collection of visualizations for IPython launched in 2015; newer entries below may have overtaken it.
- 1
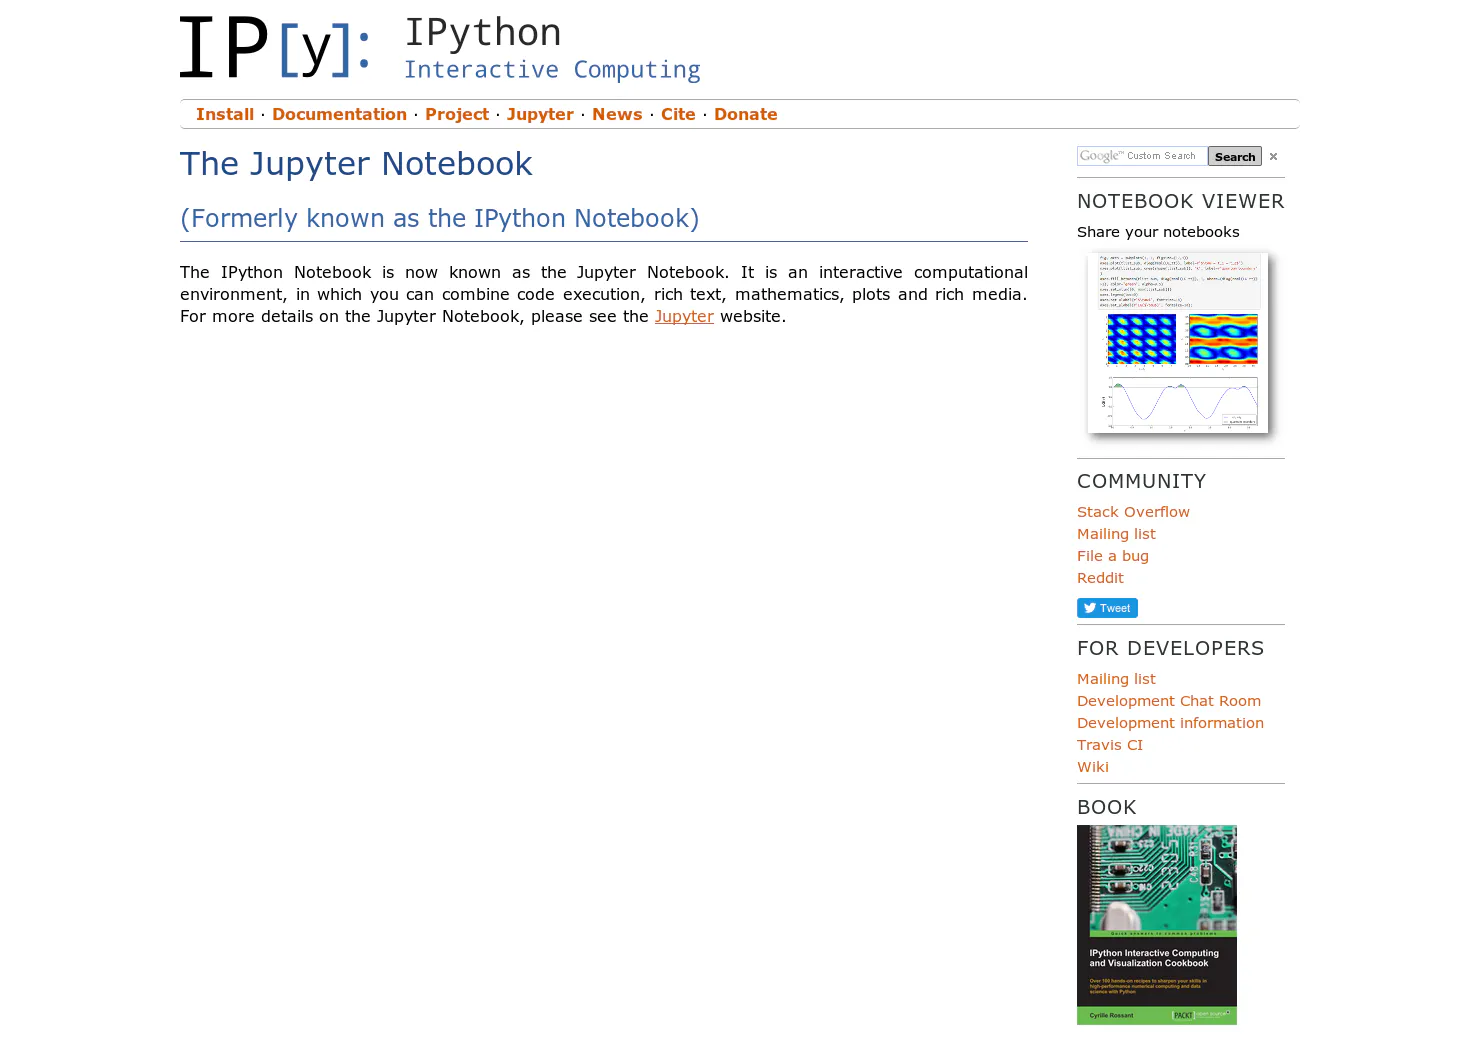
One document with code, text, math, charts and rich media.
2014 · ipython.org · its alternatives →
- 2

3d plotting for Python in the Jupyter notebook based on IPython widgets using WebGL - widgetti/ipyvolume
2017 · github.com · its alternatives →
- 3

2015 · nbviewer.ipython.org · its alternatives →
- 4

- 5
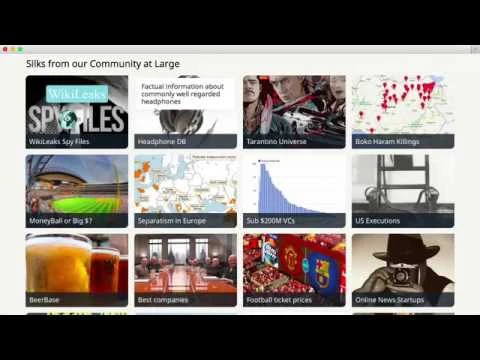
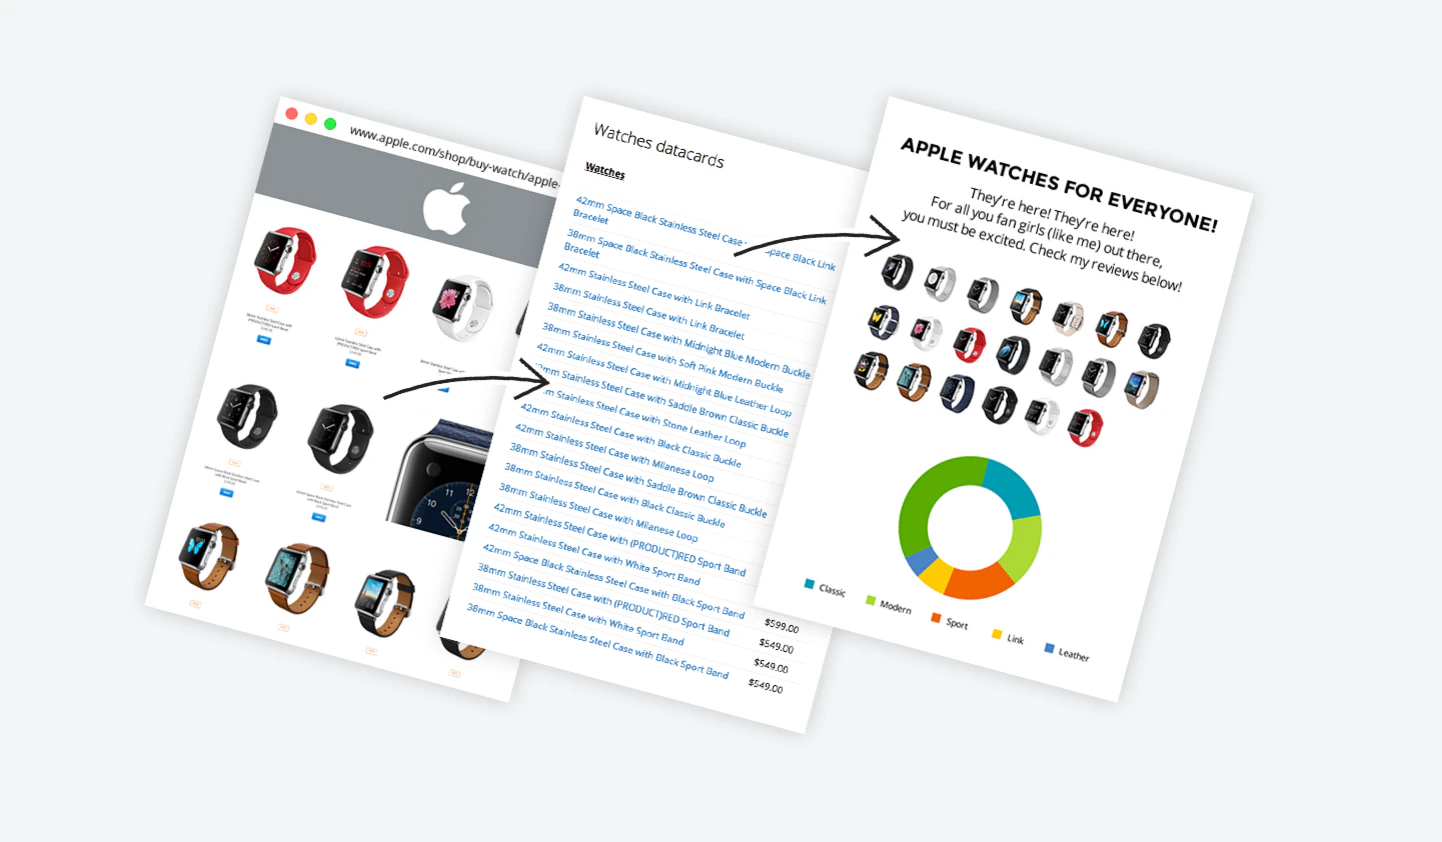 Silk + import.io▲220
Turn millions of Web pages into your own visualizations
2015 · its alternatives →
- 6

- 7
 Makerlist▲197
A curated list of the best resources for makers
2015 · makerlist.io · its alternatives →
- 8

Build animated charts in Jupyter Notebook and similar environments with a simple Python syntax. - vizzuhq/ipyvizzu
2022 · github.com · its alternatives →
- 9
- 10

New Chrome extension to monitor a website/area of a website
2014 · chromewebstore.google.com · its alternatives →
- 11P5Pywebview 5▲126
I am happy to announce the next major version of pywebview, a lightweight Python framework for building modern desktop applications with web technologies. The new version introduces powerful state management, network event handling, and significant improvements to Android support. See https://pywebview.flowrl.com/blog/pywebview6.html for details.
2024 · pywebview.flowrl.com · its alternatives →
- 12
- 13

Make powerful, interactive machine learning visualizations
2020 · wandb.ai · its alternatives →
- 14
 Chartbrew v2▲197
Visualize data from all your data sources in one place
2022 · chartbrew.com · its alternatives →
- 15
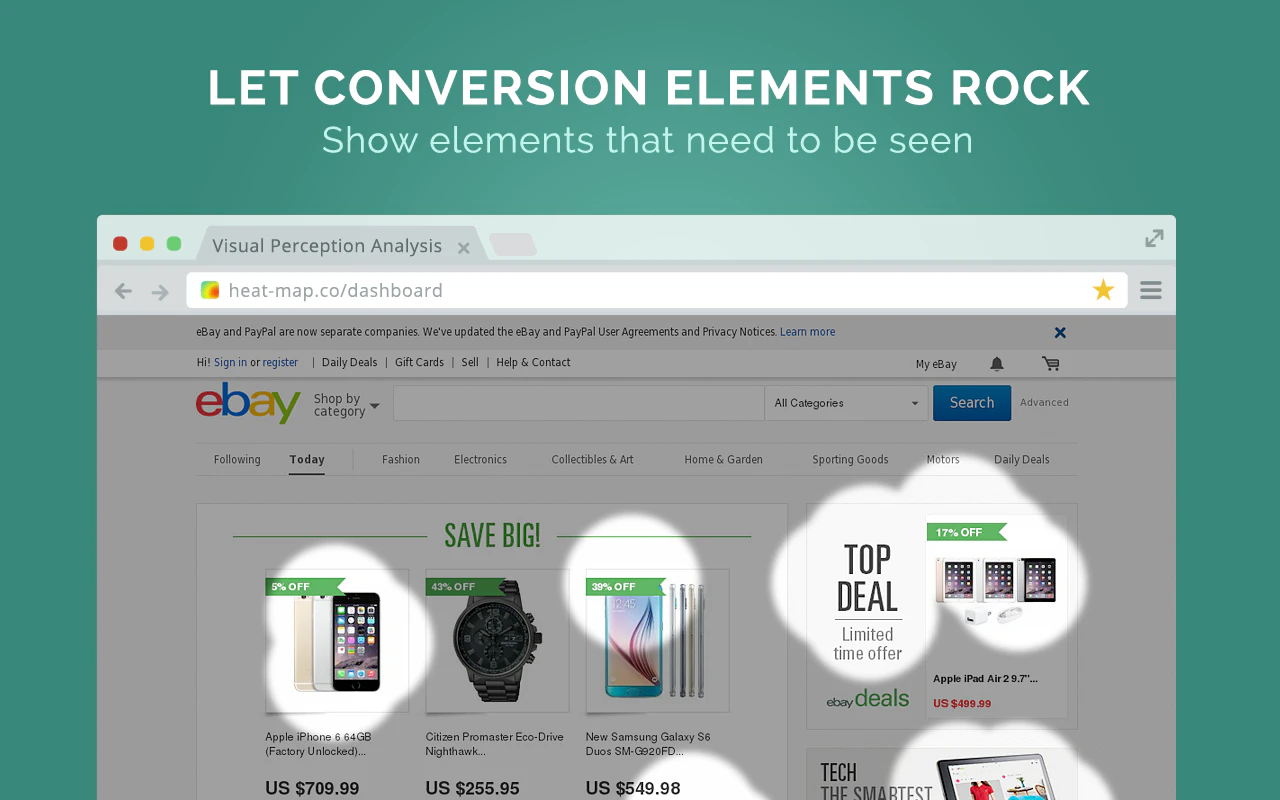 Heat-Map.co▲126
Analyze your Designs/Mockups with the help of a heat map
2014 · heat-map.co · its alternatives →
- 16

Build, present and share animated data stories in Jupyter Notebook and similar environments. - vizzuhq/ipyvizzu-story
2022 · github.com · its alternatives →
- 17

- 18

- 19

A practical book on Data Analysis with Rust Notebooks that teaches you the concepts and how they’re implemented in practice.
2020 · datacrayon.com · its alternatives →
- 20

- 21
- 22

Reference tool for data visualisation
2016 · datavizcatalogue.com · its alternatives →
- 23

An ChatGPT integration for Jupyter Notebooks and the IPython Shell - santiagobasulto/ipython-gpt
2023 · github.com · its alternatives →
- 24

Also compare
Ranked by how close each launch is in meaning, then by votes. Prices were read from each product’s own site when checked and can change. Refine with your own description →