Alternatives
Products that do what Catp – print the output of a running process does
- 1WE
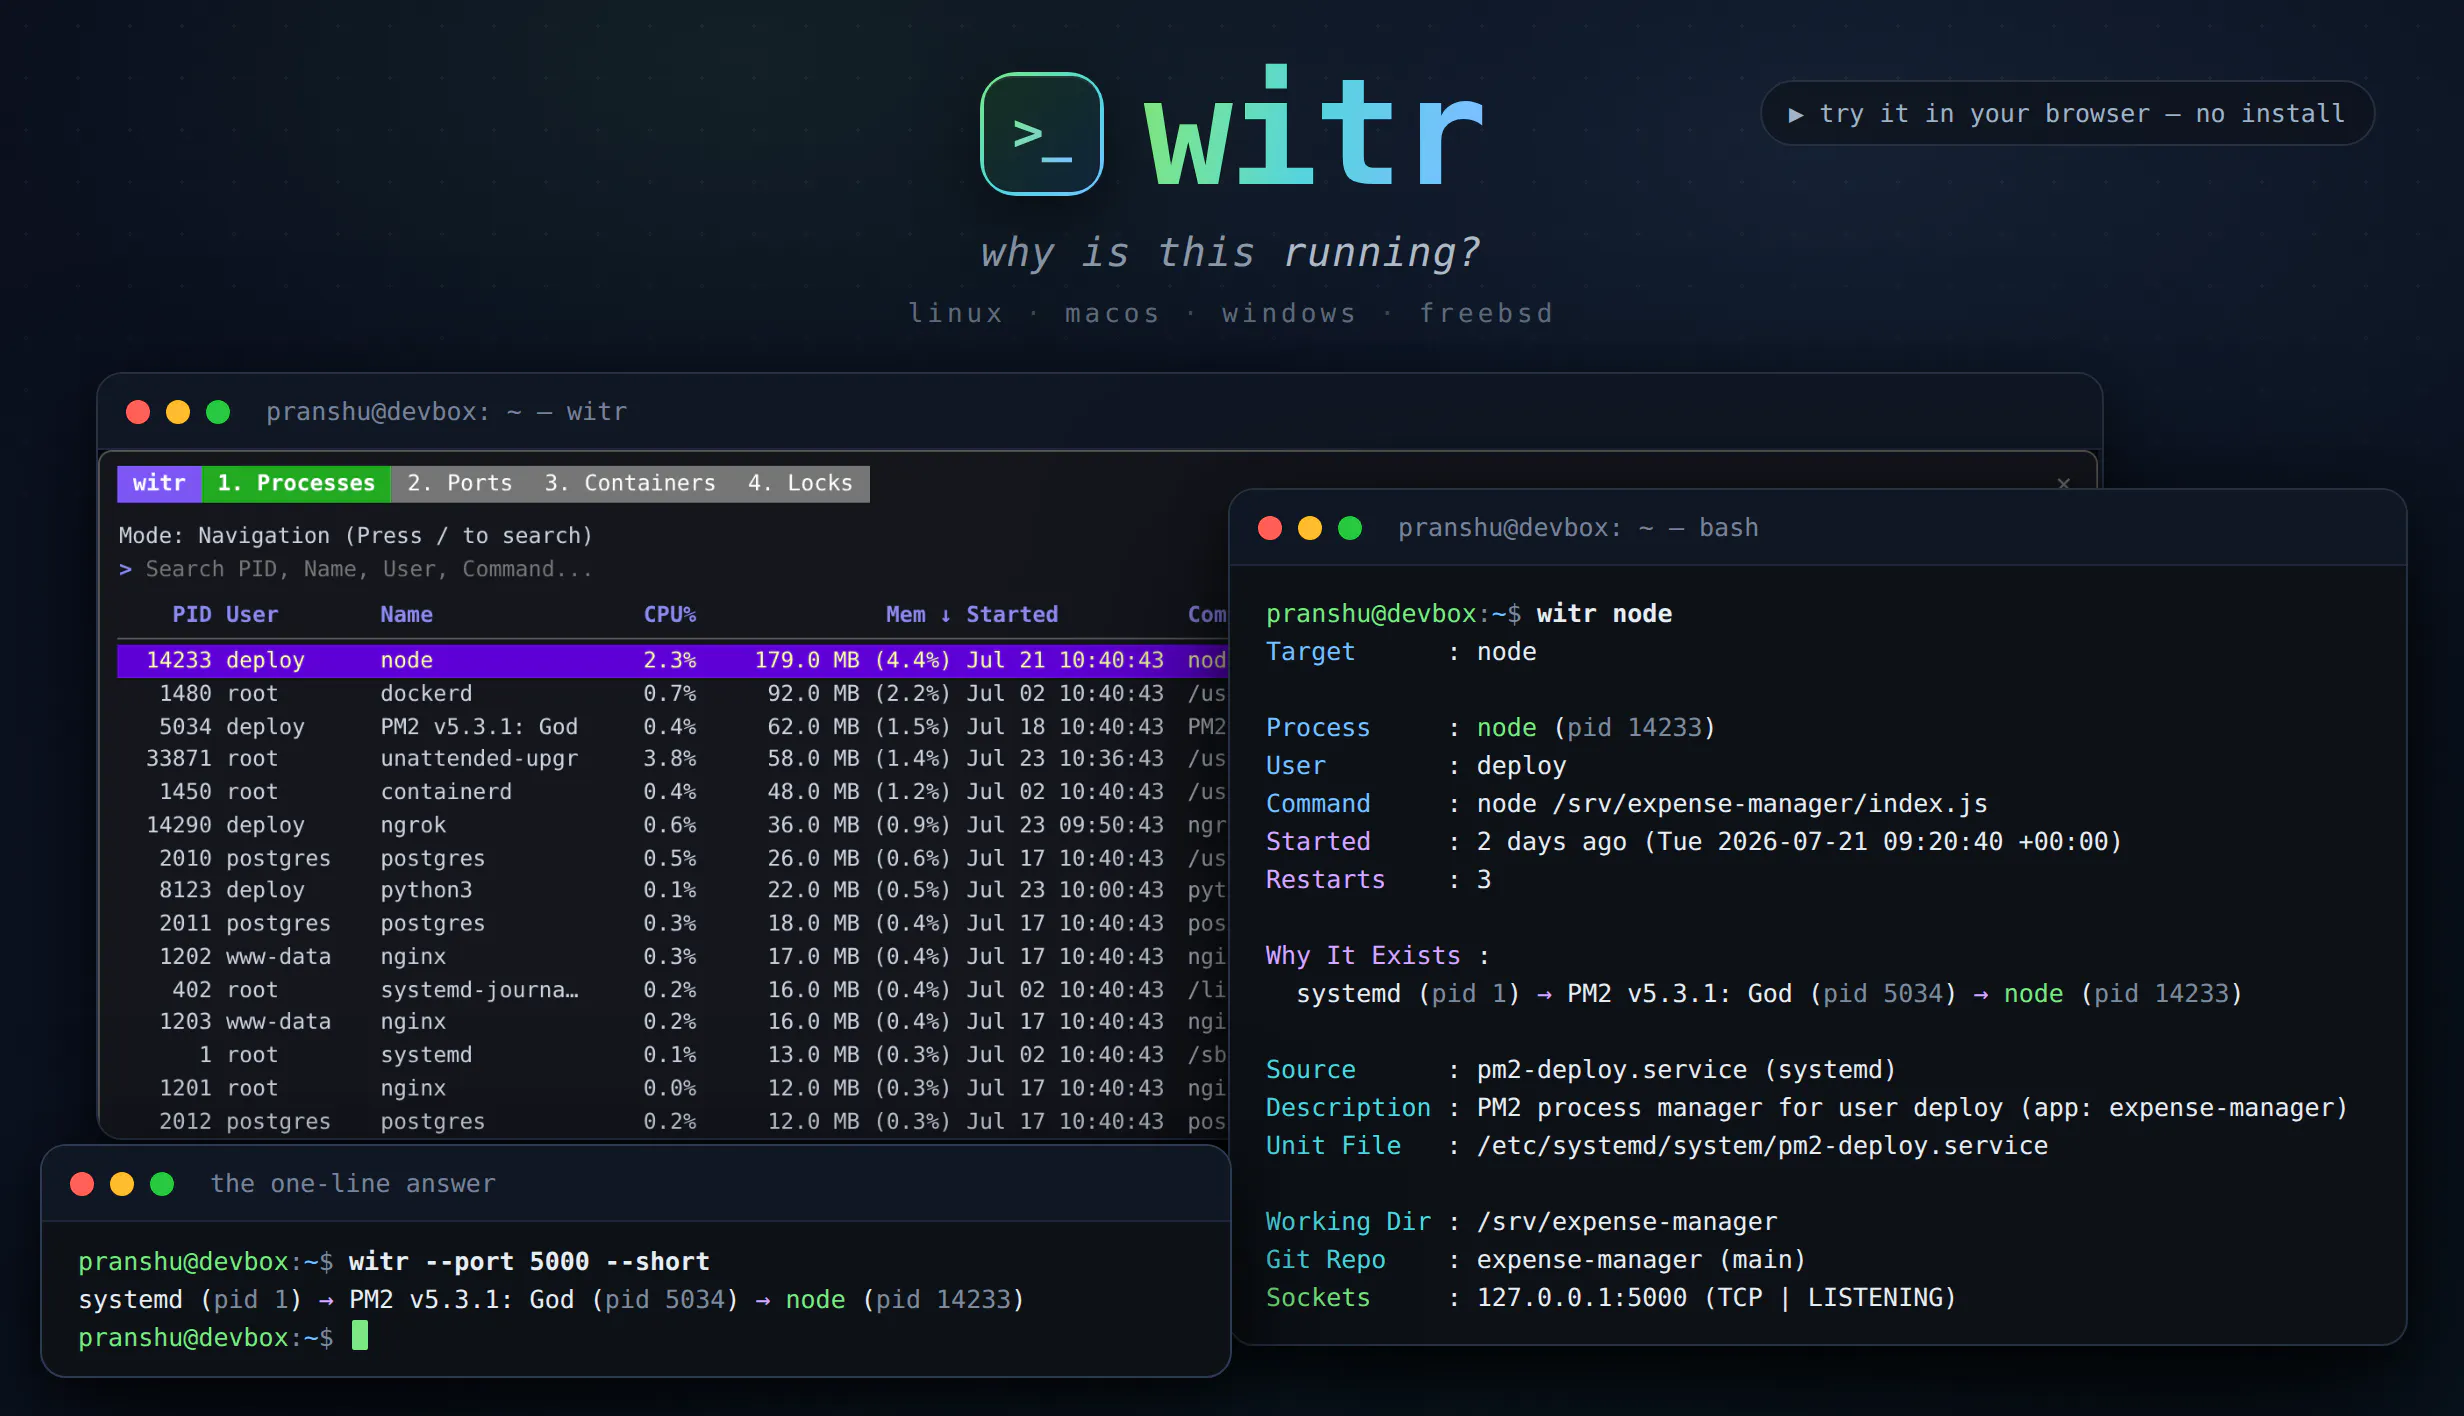
Hi HN, I built a small Linux CLI tool called witr (Why Is This Running?). The idea came from a situation most of us have hit: you log into a machine, see a process or port running, and immediately wonder why it exists, who started it, and what is keeping it alive right now. witr traces a process, service, or port back to its origin and responsibility chain and explains it in a way that’s quick to read, especially when you’re debugging under pressure. This is v0.1.0. It’s intentionally small and focused. Feedback, criticism, and edge cases are very welcome. Repo:…
Dec 2025 · github.com
- 2

- 3
- 4TA
Note: this is an update to [this](https://news.ycombinator.com/item?id=44568529) "Show HN" post. timep is a state-of-the-art [debug-]trap-based bash profiler that is efficient and extremely accurate. Unlike other profilers, timep records: 1. per-command wall-clock time 2. per-command CPU time, and 3. the hierarchy of parent function calls /subshells for each command the wall-clock + CPU time combination allows you to determine if a particular command is CPU-bound or IO-bound, and the hierarchical logging gives you a map of how the code actually executed. The standout…
2025 · github.com
- 5

- 6
- 7PA
pypipe is a command-line tool for writing data pipelines in Python. When working with data processing in the terminal, I often find myself wanting to pass the output of commands to Python for further processing. In such cases, one can either write one-liners or create regular Python scripts and connect them through pipes. However, using pypipe makes this process more convenient and efficient.
2023 · github.com
- 8AR
- 9SA
Mar 2026 · github.com
- 10LT
2014 · github.com
- 11

- 12UT
2021 · github.com
- 13CA
Hey! We are presenting CodeTracer - a user-friendly time-traveling debugger designed to support a wide range of programming languages: https://github.com/metacraft-labs/codetracer?tab=readme-ov-f... CodeTracer records the execution of a program into a sharable self-contained trace file. You can load the produced trace files in a GUI environment that allows you to move forward and backward through the execution and to examine the history of all memory locations. They say a picture is worth a thousand words — well, a video is even better! Watch the demo below to see…
2025 · github.com
- 14TA
timep is a TIME Profiler for bash code that will give you an accurate per-command execution time breakdown of any bash script or function. Unlike other profilers, timep also recovers and hierarchally records metadata on subshell and function nesting, allowing it to recreate the full call-stack tree for the bash code being profiled. If you call timep with the `--flame` flag, it will automatically generate a flamegraph .svg image where each block represents the wall-clock time spent on a particular command (top level) or its parent subshells/functions (all the other levels). Using timep…
2025 · github.com
- 15UA
Hi! I've been building a debugger on my nights and weekends because it's fun, and I personally need a better debugger for my work. GDB and LLDB pain me greatly; we can and will do better! As explained in the README, it's still very early-days and it's not ready for use yet, but check back often because it's improving all the time! Check out https://calabro.io/uscope for a more detailed explanation. Thanks for taking a look!
2025 · github.com
- 16

- 17KA
2025 · davidesantangelo.github.io
- 18TT
tracexec helps you to figure out what and how programs get executed when you execute a command. It's useful for debugging build systems, catching fd leaks, understanding what shell scripts actually do, figuring out what programs does a proprietary software run, etc.
2024 · github.com
- 19
- 20AP
Hey HN, I made a Windows process monitor for app developers and advanced end users. I wanted a taskmgr system-level graph view per app. Windows procmon, while capable, has always been tedious to set up (esp. if not used often). That's pretty much the whole idea behind the app--to simplify app-level monitoring, to make it easy. I hope some of you find it useful!
2025 · pragmar.com
- 21

- 22PA
2015 · github.com
- 23WW
2020 · github.com
- 24WM
2025 · npmjs.com
Ranked by how close each launch is in meaning, then by votes. Refine with a description →