Dev tools · alternatives · 2026

24 alternatives to Chart.xkcd – Xkcd-styled chart library
xkcd styled chart lib. Contribute to timqian/chart.xkcd development by creating an account on GitHub.
Chart.xkcd is a charting library that creates graphs styled like xkcd comics. It generates charts with the distinctive hand-drawn aesthetic of xkcd's webcomic style. The library is designed for developers and data… Below are 24 products that do a similar job, ranked by how close each is in meaning and then by launch-day votes. Chart.xkcd – Xkcd-styled chart library launched in 2019; newer entries below may have overtaken it.
- 1

- 2AW
2013 · cmx.io · its alternatives →
- 3
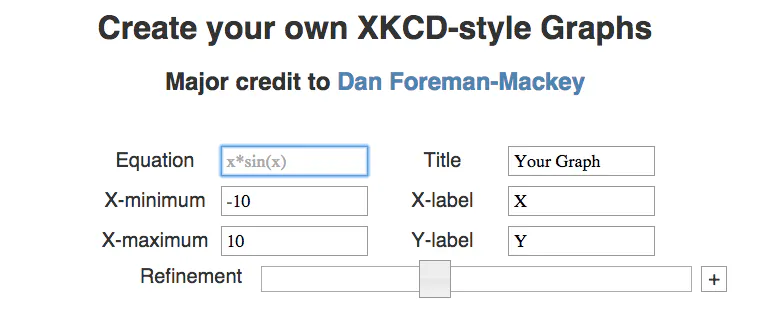
- 4XI
2013 · gkoberger.github.com · its alternatives →
- 5

Create pro-level graphs that drive actions
2024 · graphy.app · its alternatives →
- 6
 Charts▲348
The most comprehensive collection of charts for Sketch
2019 · charts.graphics · its alternatives →
- 7

Many JS libraries exist to build graphs on the web (Vega, chartJS, Plotly...). They allow to make charts quickly. But you lose flexibility: you're limited by the options they offer. I just created a gallery with hundreds of graphs made with d3.js and React. - Examples are split by graph types - They all come with explanation and code sandboxes - Gradual complexity to ease the learning curve It took me ages to create this project! Feedback welcome!
2023 · react-graph-gallery.com · its alternatives →
- 8TL
2018 · charts.com · its alternatives →
- 9

- 10
 MRRArt Pro▲568
Create beautiful text charts (ascii) from your data
2023 · mrrartpro.com · its alternatives →
- 11CC
2020 · rbitr.github.io · its alternatives →
- 12
 VizzyCharts▲67
Quickly generate editable graphs and charts in Adobe XD.
2019 · vizzycharts.com · its alternatives →
- 13

Hey all! I released drawDB about a month ago and now it's open source. I hope you find it useful. If you want to check out the app you can go to https://drawdb.vercel.app/ . Thank you:)
2024 · github.com · its alternatives →
- 14CA
Last year we launched ChartDB OSS (https://news.ycombinator.com/item?id=44972238) - an open-source tool that generates ER diagrams from your database (via query/sql/dbml) without needing direct DB access. Now we’re launching the ChartDB Agent. It helps you design databases from scratch or make schema changes with natural language. You can: - Generate schemas by simply describing them in plain English - Brainstorm new tables, columns, and relationships with AI - Iterate visually in a diagram (ERD) - Deterministically export SQL script Try it out here -…
2025 · app.chartdb.io · its alternatives →
- 15
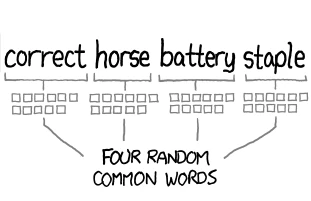
Generate XKCD-style passwords in your language!
2016 · optionfactory.net · its alternatives →
- 16MA
2024 · mermaid-ascii.art · its alternatives →
- 17

Hey HN! We are Jonathan & Guy, and we are happy to share a project we’ve been working on. ChartDB is a tool to help developers and data analysts quickly visualize database schemas by generating ER diagrams with just one query. A unique feature of our product is AI-Powered export for easy migration. You can give it a try at https://chartdb.io and find the source code on GitHub. Next steps ---> More AI. We’d love feedback :)
2024 · github.com · its alternatives →
- 18

Graphic is a grammar of data visualization and Flutter charting library, with there features: - A Grammar of Graphics: Graphic derives from Leland Wilkinson's book The Grammar of Graphics, and tries to balance between theoretical beauty and practicability. It inherits most concepts, like the graphic algebra. - Declarative and Reactive: As is encouraged in Flutter, the chart widget of Graphic is declarative and reactive. The grammar of data visualization is implemented by a declarative specification and the chart will reevaluate automatically on widget update. - Interactive: With the signal…
2023 · github.com · its alternatives →
- 19
 Rough Charts▲145
A responsive react charting library with a hand-drawn style.
2019 · github.com · its alternatives →
- 20

Ultra-fast and customizable Python charts. Contribute to reflex-dev/xy development by creating an account on GitHub.
Jul 2026 · github.com · its alternatives →
- 21

- 22

2020 · andrewfulrich.gitlab.io · its alternatives →
- 23
 Chart.js▲263
Simple, clean & engaging charts for designers and developers
2014 · chartjs.org · its alternatives →
- 24

🧜♀️ RESTful rendering pipeline for generating sequence and UML diagrams using Mermaid for Markdown docs (Diagrams as a Service) - Schachte/Mermrender
2019 · github.com · its alternatives →
Also compare
Ranked by how close each launch is in meaning, then by votes. Prices were read from each product’s own site when checked and can change. Refine with your own description →