Growth · alternatives · 2026

24 alternatives to Chartopedia
The simplest way to choose the right chart type for dataviz
Below are 24 products that do a similar job, ranked by how close each is in meaning and then by launch-day votes. Chartopedia launched in 2017; newer entries below may have overtaken it.
- 1

Usage Type | Chartopedia is an information resource that allows you to discover as many details about any type of chart supported in our JavaScript (HTML5) charting libraries
2017 · anychart.com · its alternatives →
- 2
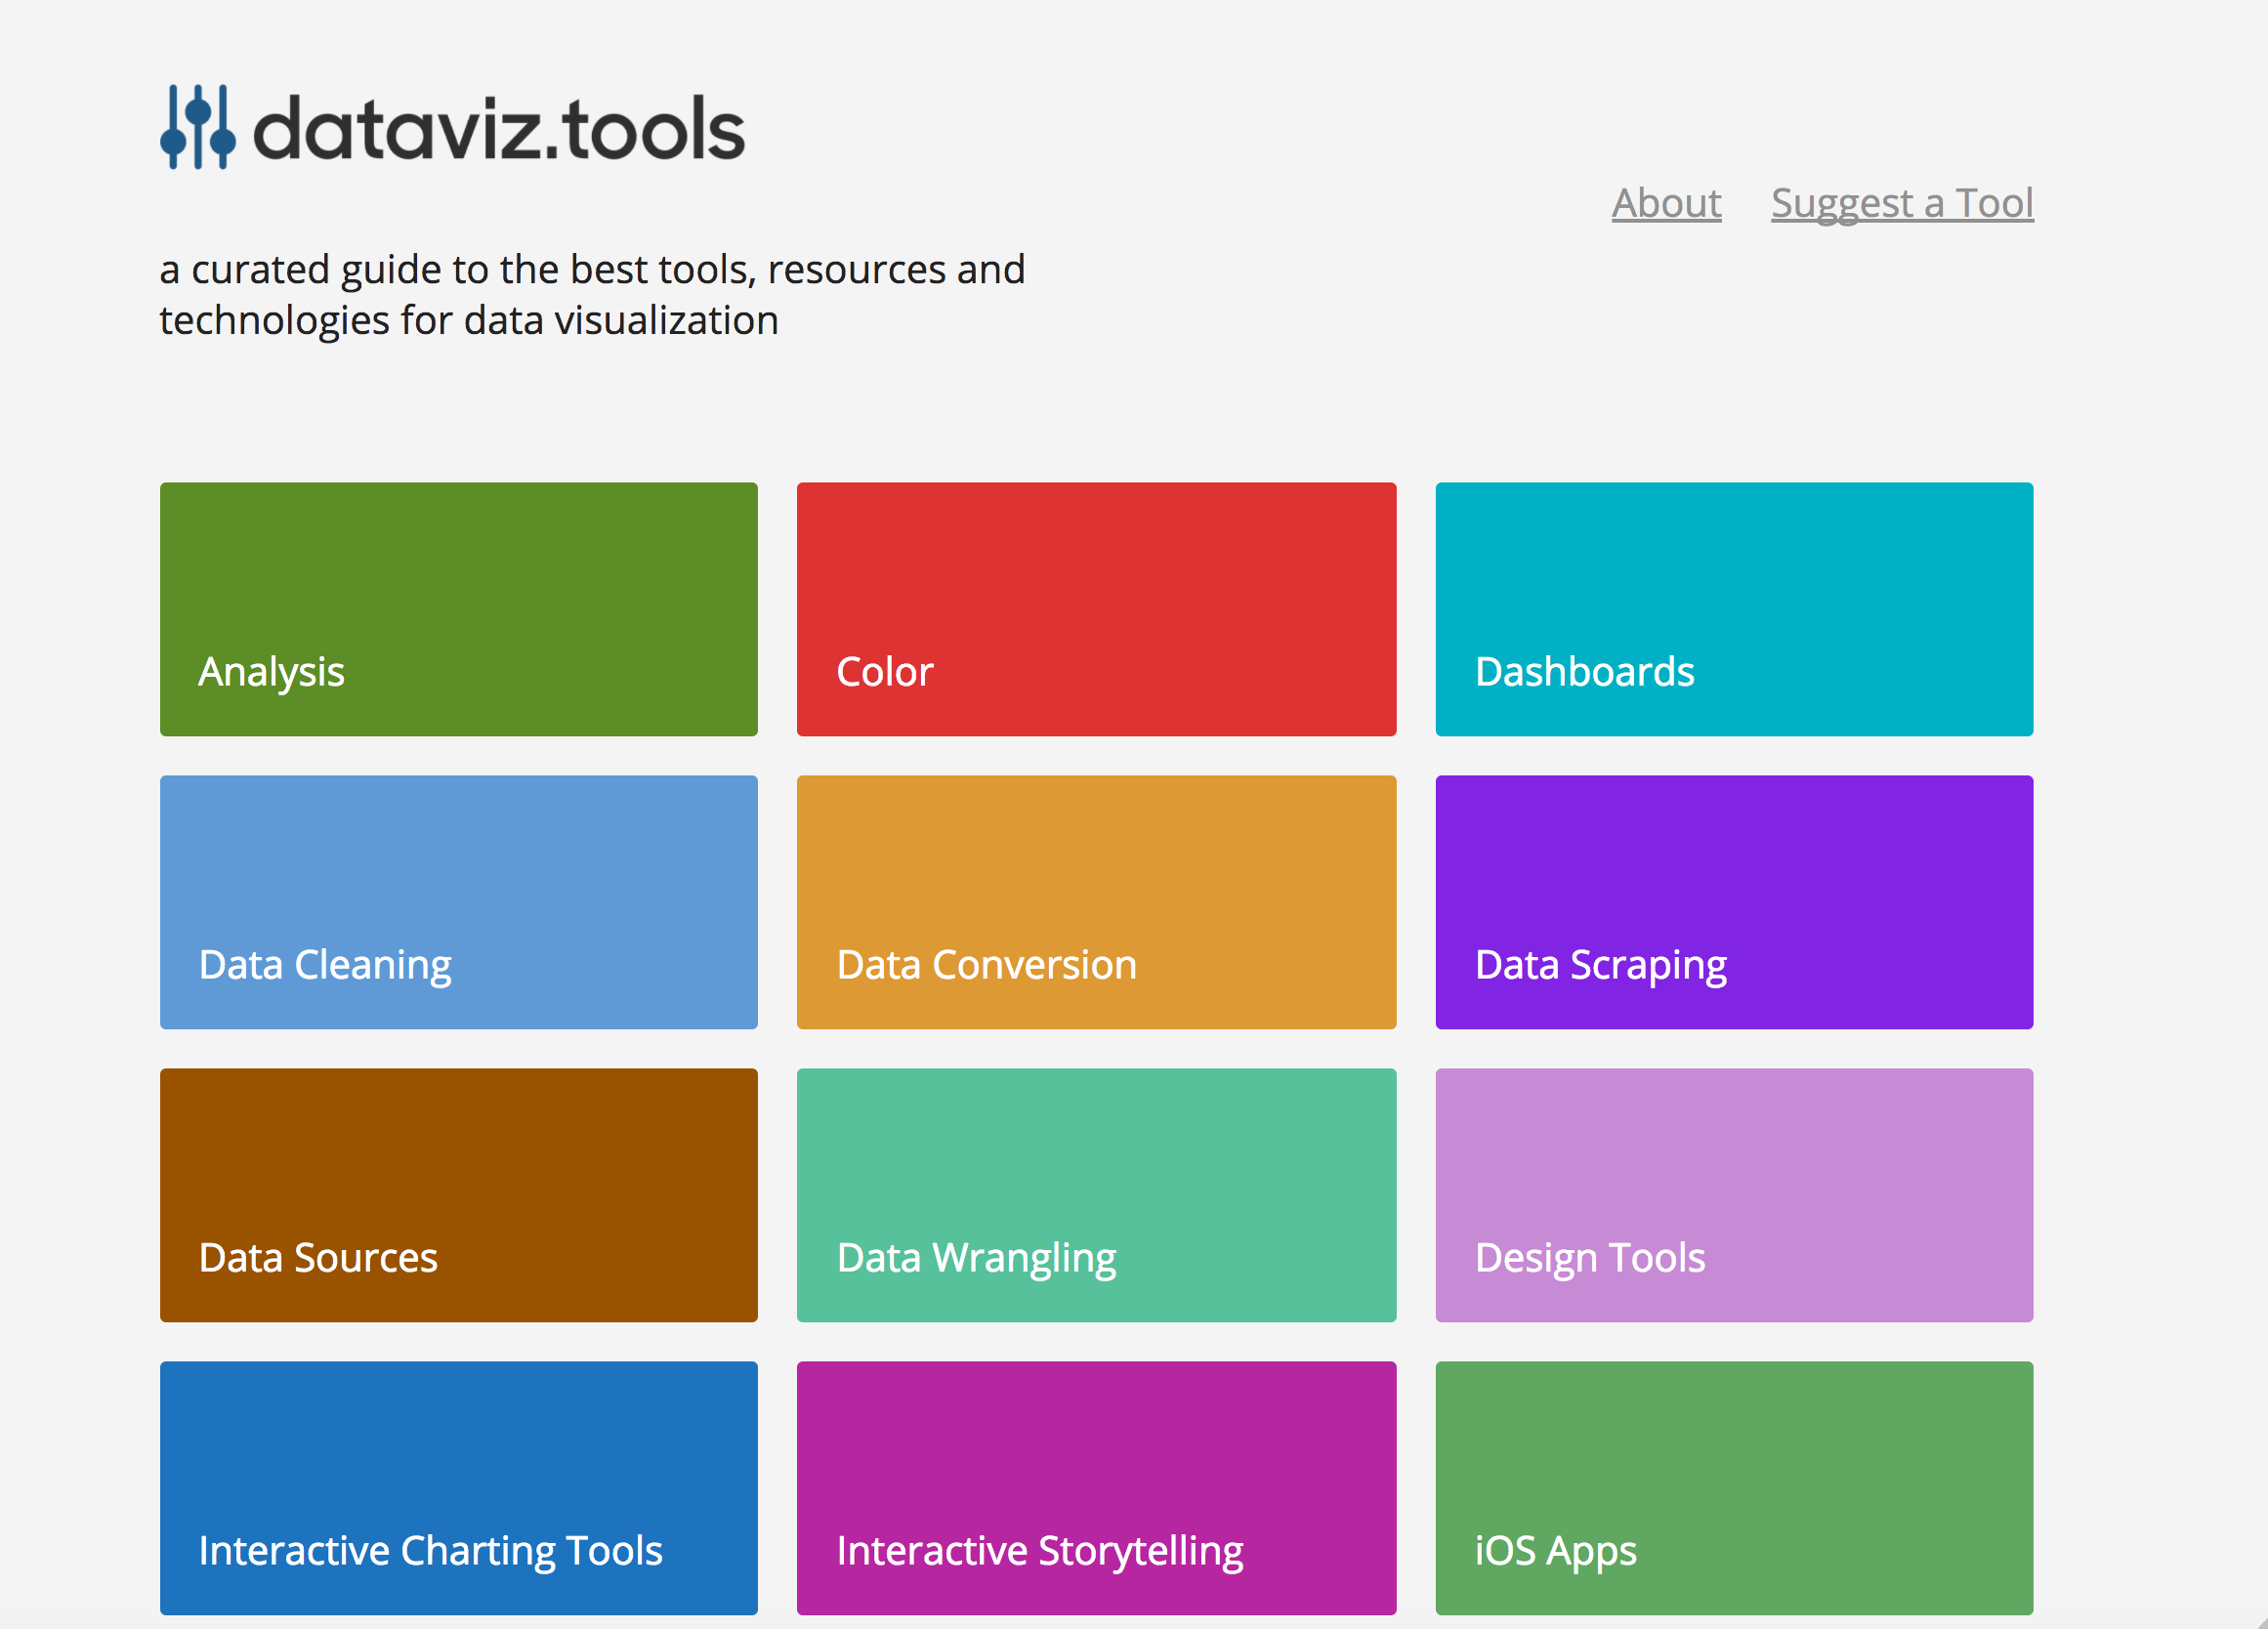 dataviz.tools▲409
Curated collection of the 400 best data visualization tools
2017 · dataviz.tools · its alternatives →
- 3

- 4

Catalog of all chart types and tools to build them
2017 · visualizationuniverse.com · its alternatives →
- 5

- 6
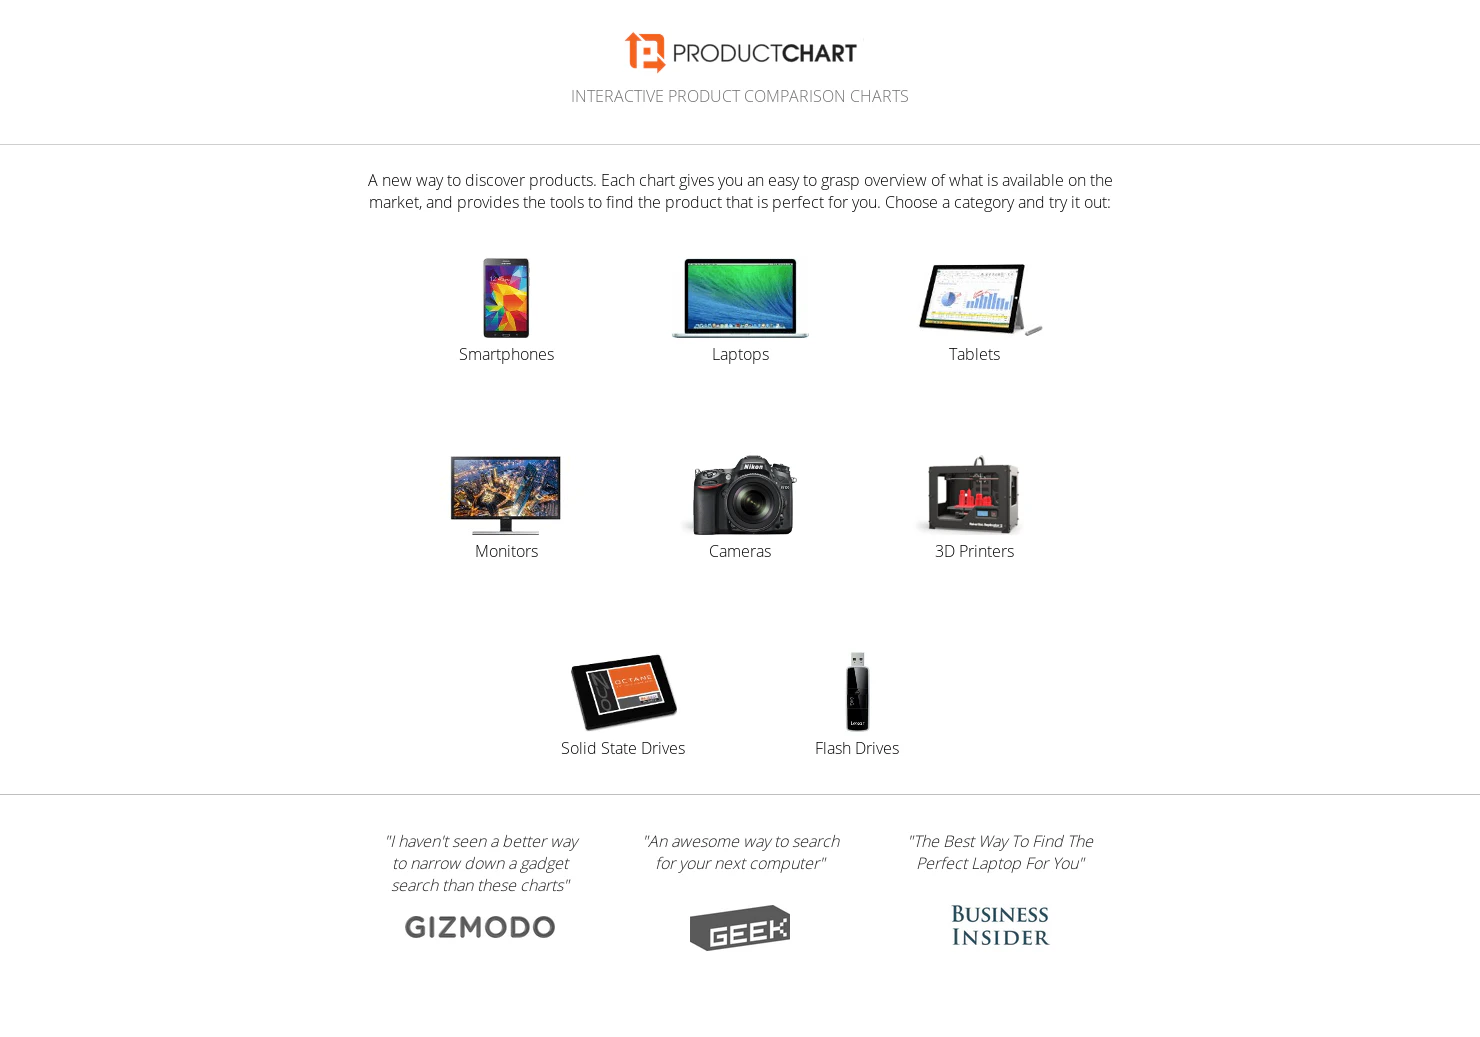 Product Chart▲118
Interactive comparison charts of laptops, smartphones & more
2015 · productchart.com · its alternatives →
- 7

- 8
 InsightHack▲114
Free & searchable databases - companies, trends, funding
2022 · insighthack.com · its alternatives →
- 9
- 10

- 11

- 12

- 13

- 14
 CalcGen AI▲123
Beautifully interactive data visualizations. One prompt.
2024 · welcome.calcgen.ai · its alternatives →
- 15
 dataxreports.com▲118
Browse our ready-to-use Google Data Studio templates
2024 · dataxreports.com · its alternatives →
- 16

- 17
- 18

- 19
 Statpedia▲125
Simple chart creation tool, create one in seconds.
2016 · statpedia.com · its alternatives →
- 20

Find the right data visualization tool: 291 charting libraries, maps, graph and network visualization, dashboards and more for JavaScript, Python, R and beyond, with live GitHub stars and activity.
17d ago · awesomedataviz.com · its alternatives →
- 21
 TimelineJS▲87
Beautifully crafted timelines that are easy to use.
2014 · timeline.knightlab.com · its alternatives →
- 22

Gen AI charting, dashboards & alerts on mobile & the web
2023 · its alternatives →
- 23IM
2013 · ginicharts.com · its alternatives →
- 24WB
Most analytics tools give you 10–15 chart types and call it a day. But what happens when none of them actually represent your data well? We ran into this when building a CRM dashboard. We wanted to show how sales reps connect to open deals: not just totals, but actual relationships. A bar chart was too flat, a table too dense. We needed a network graph. The problem? Most chart libraries and BI tools don’t support that out of the box. You either say “no” to the feature request, or you hack together a standalone visualization that breaks the product’s flow (no filters, no interactivity, no…
Oct 2025 · its alternatives →
Also compare
Ranked by how close each launch is in meaning, then by votes. Prices were read from each product’s own site when checked and can change. Refine with your own description →