Work · alternatives · 2026

24 alternatives to CriticalPath – Advanced Profiler for Android
I am excited to announce the project I am working on: an advanced mobile app profiler for Android. Its primary purpose is to optimize app performance and make it faster. Additionally, it serves as an excellent debugging tool. The main distinction between existing tools, such as Perfetto and the Android Studio Profiler, is the ability to synchronize the trace with a video recording of your app. This allows you to see the app's UX alongside what's occurring within the app to identify what's causing slowdowns. Another key feature is the ability to click on any slice and view the cross-thread…
CriticalPath is an advanced profiler for Android that helps developers optimize app performance and debug issues. It synchronizes performance traces with video recordings of the app, allowing developers to see the user… Below are 24 products that do a similar job, ranked by how close each is in meaning and then by launch-day votes. CriticalPath – Advanced Profiler for Android launched in 2024; newer entries below may have overtaken it.
- 1
 Specto▲89
Production profiling and perf monitoring for iOS & Android
2021 · sentry.io · its alternatives →
- 2
 AppFollow 2.0▲338
The best way to track app activities in the appstores
2016 · appfollow.io · its alternatives →
- 3
 PixelSnap 2▲543
The fastest tool for measuring anything on your screen ✨
2019 · pixelsnap.com · its alternatives →
- 4
 Layerpath▲389
Create interactive demos, guides & videos in minutes
2024 · layerpath.com · its alternatives →
- 5

- 6
 TimeFly Dev▲309
TimeFly tracks your coding to stop procrastinating and finish your projects. Built because I kept getting excited about side features and forgetting my goals. See your real coding patterns and ship what matters. Full details on the site.
2025 · timefly.dev · its alternatives →
- 7
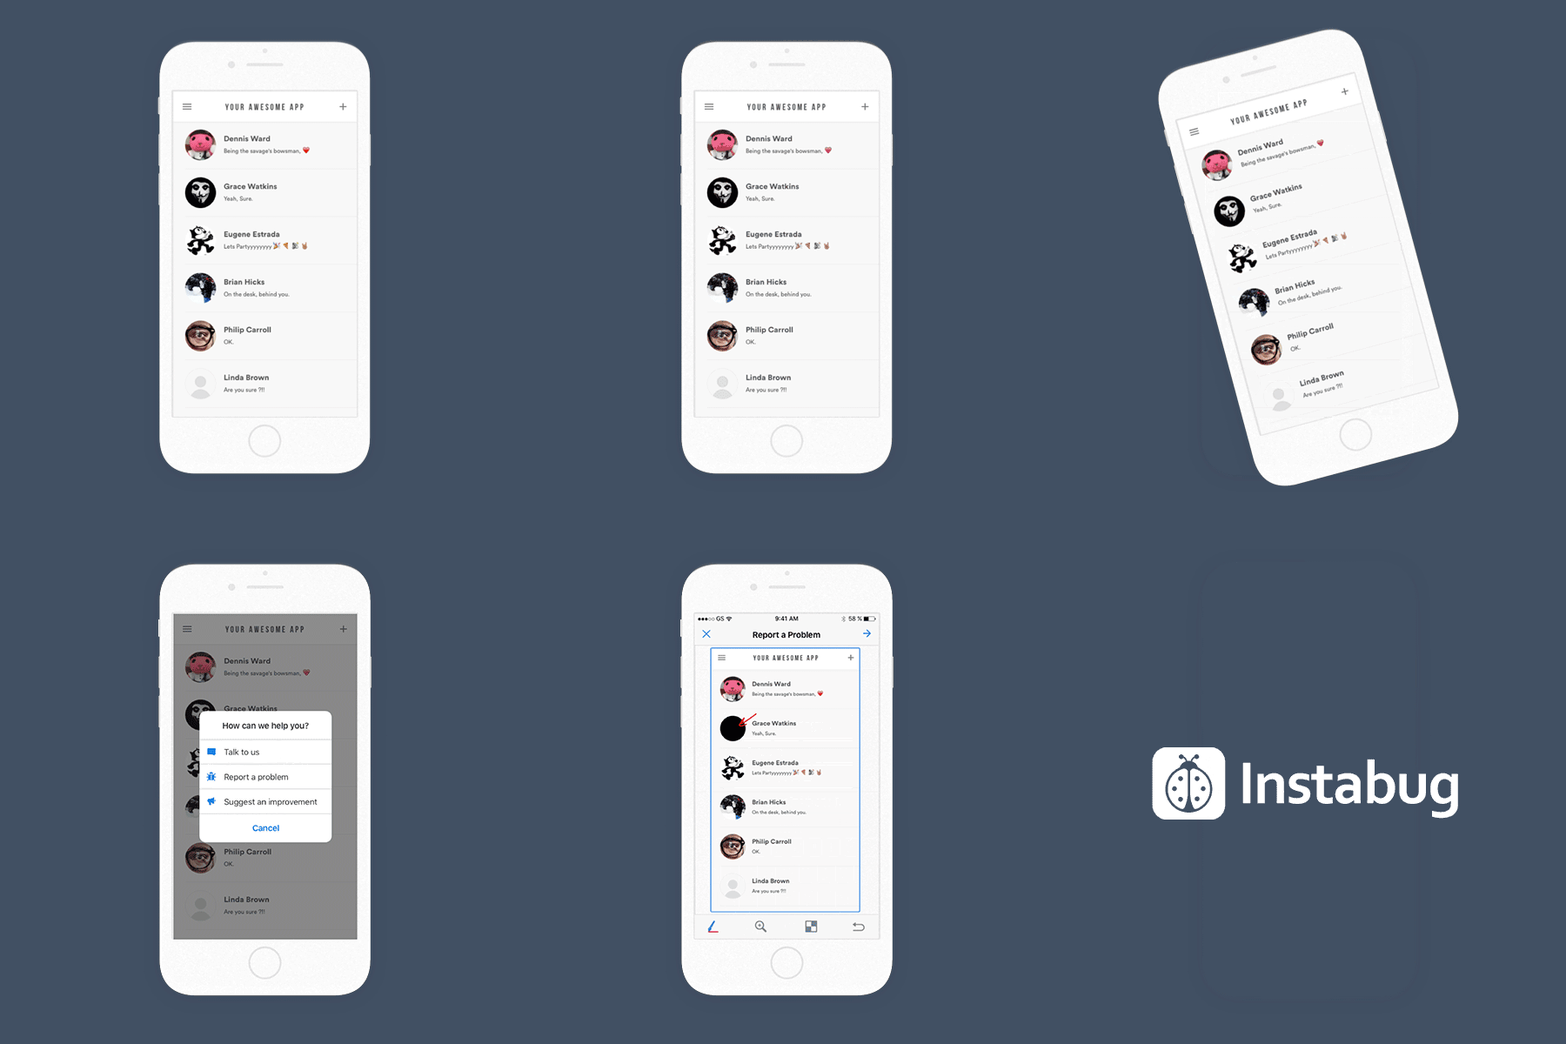
- 8

Hey HN. We’re Jay and Vadim from Highlight.io (https://highlight.io). We’re building an open source [1] monitoring platform for web applications. Today we’re excited to be sharing a performance tool we’ve been working on, which helps you inspect the latency of code execution from the client to the server. As engineers at past startups, we often had to debug slow queries, poor load times, inconsistent errors, etc... While tools like Jaegar [2] helped us inspect server-side performance, we had no way to tie user events to the traces we were inspecting. In other words, although we had…
2024 · github.com · its alternatives →
- 9

Hey HN, I made a Windows process monitor for app developers and advanced end users. I wanted a taskmgr system-level graph view per app. Windows procmon, while capable, has always been tedious to set up (esp. if not used often). That's pretty much the whole idea behind the app--to simplify app-level monitoring, to make it easy. I hope some of you find it useful!
2025 · pragmar.com · its alternatives →
- 10PN
Hello HN, Long-time lurker, first-time poster here. I've created a service that creates a "flow map" of your mobile app. Check it out at: https://prodscape.net. The goal is to reduce last-minute regressions, promote holistic discussion, and help develop more ownership within an organization. This is something that I would have liked to have had when I was working at a big company. Some caveats: 1.) Only iOS is currently supported but Android-support will be coming soon. 2.) You need a developer-signed IPA file (see the guide on creating an IPA file here:…
2022 · its alternatives →
- 11AA
2013 · newton.apptimize.com · its alternatives →
- 12

Hey HN! We are happy to share Perforator – our internal cluster-wide profiler with great support for native languages and a built-in AutoFDO pipeline to simplify sPGO builds. Perforator allows you to profile most binaries without having to recompile or adjust the build process. We use it at Yandex to profile each pod inside a large cluster at modest speed (99Hz), collecting petabytes of profiles every day. There's a blog post about it at https://medium.com/yandex/yandexs-high-performance-profiler-.... Inspired by Google-Wide Profiling, we started continuous profiling…
2025 · github.com · its alternatives →
- 13

Contribute to alvins82/java-mini-profiler-core development by creating an account on GitHub.
2013 · github.com · its alternatives →
- 14

Application performance monitoring built for mobile apps
2020 · luciq.ai · its alternatives →
- 15
- 16

Morning HN. I often found myself wondering "how much does this code segment take in terms of total runtime" and it's often quite annoying to figure out with optimizations enabled, especially when working on something new or testing someone else's implementation without the proper tooling set up. Wanted to have a single include lib that would allow us to write something like: ``` PROFILE("Loop 1") for (...) // some work ``` and have the next expression automatically record time & dump results to a table. Wrote a few macros to do exactly that a few months back, but they were…
2025 · github.com · its alternatives →
- 17

- 18

DEPRECATED StackImpact Python Profiler - Production-Grade Performance Profiler: CPU, memory allocations, blocking calls, exceptions, metrics, and more - stackimpact/stackimpact-python
2017 · github.com · its alternatives →
- 19

Luciq captures 100% of mobile sessions at the device edge, structures them into agent-ready context, and delivers it to any agent over MCP, CLI, and API.
2020 · instabug.com · its alternatives →
- 20

Check out our new project to add some insight into OOM kill events for Go programs. Source code: https://github.com/parca-dev/oomprof/ Description of how it was put together: https://www.polarsignals.com/blog/posts/2025/08/13/oomprof
2021 · polarsignals.com · its alternatives →
- 21RT
2012 · dashboard.graphdat.com · its alternatives →
- 22

- 23TL
Hey HN! A bug has been reported. Maybe it’s the data pipeline for a particular customer, checkouts with Paypal in Australia or Bluetooth connections on older Android devices. Whatever the case is, you’re sitting there and there’s simply not enough information to diagnose the issue. Wouldn’t it be great if you could snap your fingers and start looking at DEBUG logs for just the customer in question? We think so too. This was one of the most delightful features that the core platform teams provided me when I worked at a large org and I missed it dearly after I left. Here's what Prefab provides…
2023 · prefab.cloud · its alternatives →
- 24

Also compare
Ranked by how close each launch is in meaning, then by votes. Prices were read from each product’s own site when checked and can change. Refine with your own description →