Alternatives
Products that do what DebugaBull does
Dynamically visualize local Python programs
- 1LD
Hi HN! We’re Adrien and Kanav. We met at our previous job, where we spent about a third of our lives combating a constant firehose of bugs. In the hope of reducing this pain for others in the future, we’re working on automating debugging. We’re currently working on a platform that ingests logs and then automatically reproduces, root causes and ultimately fixes production bugs as they happen. You can see some of our work on this here - https://news.ycombinator.com/item?id=39528087 As we were building the root-cause phase of our automated debugger, we realized that we developed…
2024 · github.com
- 2

- 3

- 4VD
2020 · github.com
- 5SP
Hey HN, Scripton (https://scripton.dev) is a Python IDE built for fast, interactive visualizations and exploratory programming — without the constraints of notebooks. Why another Python IDE? Scripton hopes to fill a gap in the Python development ecosystem by being an IDE that: 1. Focuses on easy, fast, and interactive visualizations (and exposes rich JS plotting libraries like Observable Plot and Plotly directly to Python) 2. Provides a tightly integrated REPL for rapid prototyping and exploration 3. Is script-centric (as opposed to, say, notebook-style) A historical detour for why…
2025 · scripton.dev
- 6HA
Hi, I created httpdbg, a tool for Python developers to easily debug HTTP(S) client requests in Python programs. I developed it because I needed a tool that could help me trace the HTTP requests sent by my tests back to the corresponding methods in our API client. The goal of this tool is to simplify the debugging process, so I designed it to be as simple as possible. It requires no external dependencies, no setup, no superuser privileges, and no code modifications. I'm sharing it with you today because I use it regularly, and it seems like others have found it useful too—so it might be…
2024 · github.com
- 7HA
Hi HN, we’re building Haystack Editor (https://haystackeditor.com/), a canvas-based IDE that automates the boring stuff (plumbing, refactoring, and finding code) so that you can focus on the exciting parts of software development! You can see a quick overview of Haystack at https://www.youtube.com/watch?v=c2uZnR5D_cc! (It's currently only on Mac OS but we're working on Linux and Windows. Edit: just added a Linux download!) Haystack was born out of our frustrations with working in large and mature codebases, specifically with navigating and editing functional…
2024 · haystackeditor.com
- 8FA
Some highlights: - 100% free and open source (https://github.com/alexmojaki/futurecoder), no ads or paid content. - No account required at any point. You can start instantly. (You can create an account if you want to save your progress online and across devices. Your email is only used for password resets) - 3 integrated debuggers can be started with one click to show what your code is doing in different ways. - Enhanced tracebacks make errors easy to understand. - Useful for anyone: You can have the above without having to look at the course. IDE mode…
2023 · futurecoder.io
- 9VD
Hey all, I've been working on this side project to get a Cypress.io-like experience, but for Ruby developers. It's plug-n-play with Capybara system tests, with the following features: - visualize assertions/commands as they happen - view all API requests, errors, and logs in the timeline - pause/continue on any step - rewind through history with a recorded video This is brand new, so looking for people to start trying it out and leave feedback.
2024 · github.com
- 10LL
Hey HN, I just built an experimental VSCode extension called LLM Debugger. It’s a proof-of-concept that lets a large language model take charge of debugging. Instead of only looking at the static code, the LLM also gets to see the live runtime state—actual variable values, function calls, branch decisions, and more. The idea is to give it enough context to help diagnose issues faster and even generate synthetic data from running programs. Here’s what it does: * Active Debugging: It integrates with Node.js debug sessions to gather runtime info (like variable states and stack traces). *…
2025 · github.com
- 11

- 12

- 13BA
Hey HN, we're developing Burr (github.com/dagworks-inc/burr), an open-source python framework that makes it easier to build and debug GenAI applications. Burr is a lightweight library that can integrate with your favorite tools and comes with a debugging UI. If you prefer a video introduction, you can watch me build a chatbot here: https://www.youtube.com/watch?v=rEZ4oDN0GdU. Common friction points we’ve seen with GenAI applications include logically modeling application flow, debugging and recreating error cases, and curating data for testing/evaluation (see…
2024 · github.com
- 14PT
2012 · pytools.codeplex.com
- 15

- 16VP
2021 · github.com
- 17DF
2019 · github.com
- 18

- 19

- 20MG
Hello everybody, I built Memory Graph to help students (and myself) build a correct mental model of Python references, mutability, and copying, and to make debugging data structures less “print-driven”. It’s inspired by Python Tutor, but focuses on clearer graphs and on running locally in many different environments and debuggers. The Memory Graph Web Debugger quickly turns your web browser into a Python debugger where the whole program state is visualized in each step, clearly showing aliasing and the structure of the data, giving insight that is hard to get with just printing. Some…
Jan 2026 · memory-graph.com
- 21VD
2020 · github.com
- 22
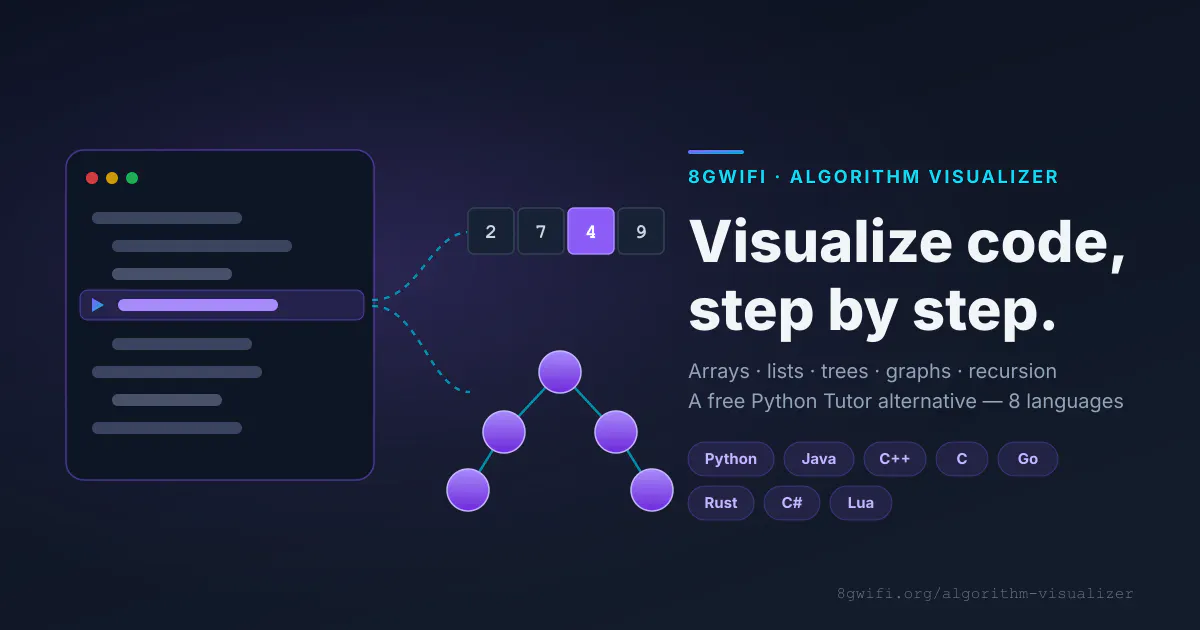
Run 20+ languages online & watch your code execute live
Jul 2026 · 8gwifi.org
- 23IR
Sharing an internal tool that accelerated my development work 10-fold, especially with API debugging. Thought fellow developers here might find it useful. As a developer, I often have trouble reproducing errors at the client end. https://intercept.rest lets me debug and monitor API requests and responses. It is similar to the Network tab in Chrome Developer Tools but works for any API: mobile apps, webhooks, frontend etc. After I shared it with a close circle of friends, they found it incredibly useful and even found new use cases, I never imagined. Been a long time lurker here and…
2018
- 24DZ
Hey HN, I tend to use printf-style debugging as my primary troubleshooting method and only resort to gdb as a last resort. While I like its ease of use printf debugging isn't without its annoyances, namely removing the print statements once you're done. I used to use trace-level logging from proper logging libraries but adding trace calls in every corner quickly gets out of control and results in an overwhelming amount of output. To scratch my own itch I created dlg - a minimal debugging library that disappears completely from production builds. Its API exposes just a single function, Printf…
2025 · github.com
Ranked by how close each launch is in meaning, then by votes. Refine with a description →