Dev tools · alternatives · 2026

24 alternatives to Get Rails performance metrics into Chrome Dev Tools
Bring Rails server-side performance metrics 📈 to Chrome's Developer Tools via the Server Timing API. Production Safe™. - scoutapp/ruby_server_timing
This tool integrates Rails performance metrics directly into Chrome Developer Tools, allowing developers to monitor application performance alongside browser debugging features. It's designed for Rails developers who… Below are 24 products that do a similar job, ranked by how close each is in meaning and then by launch-day votes. Get Rails performance metrics into Chrome Dev Tools launched in 2018; newer entries below may have overtaken it.
- 1

Hey HN. We’re Jay and Vadim from Highlight.io (https://highlight.io). We’re building an open source [1] monitoring platform for web applications. Today we’re excited to be sharing a performance tool we’ve been working on, which helps you inspect the latency of code execution from the client to the server. As engineers at past startups, we often had to debug slow queries, poor load times, inconsistent errors, etc... While tools like Jaegar [2] helped us inspect server-side performance, we had no way to tie user events to the traces we were inspecting. In other words, although we had…
2024 · github.com · its alternatives →
- 2RT
2014 · scoutapp.github.io · its alternatives →
- 3
- 4
 RoRvsWild▲84
Performances and errors monitoring for Ruby on Rails apps.
2017 · rorvswild.com · its alternatives →
- 5IB
Senior full stack software engineer with 8+ years shipping production systems in React, Node.js, Python, and Rails. Previously a Product Engineer at Ghost. Based in South Korea.
2021 · ronaldlangeveld.com · its alternatives →
- 6

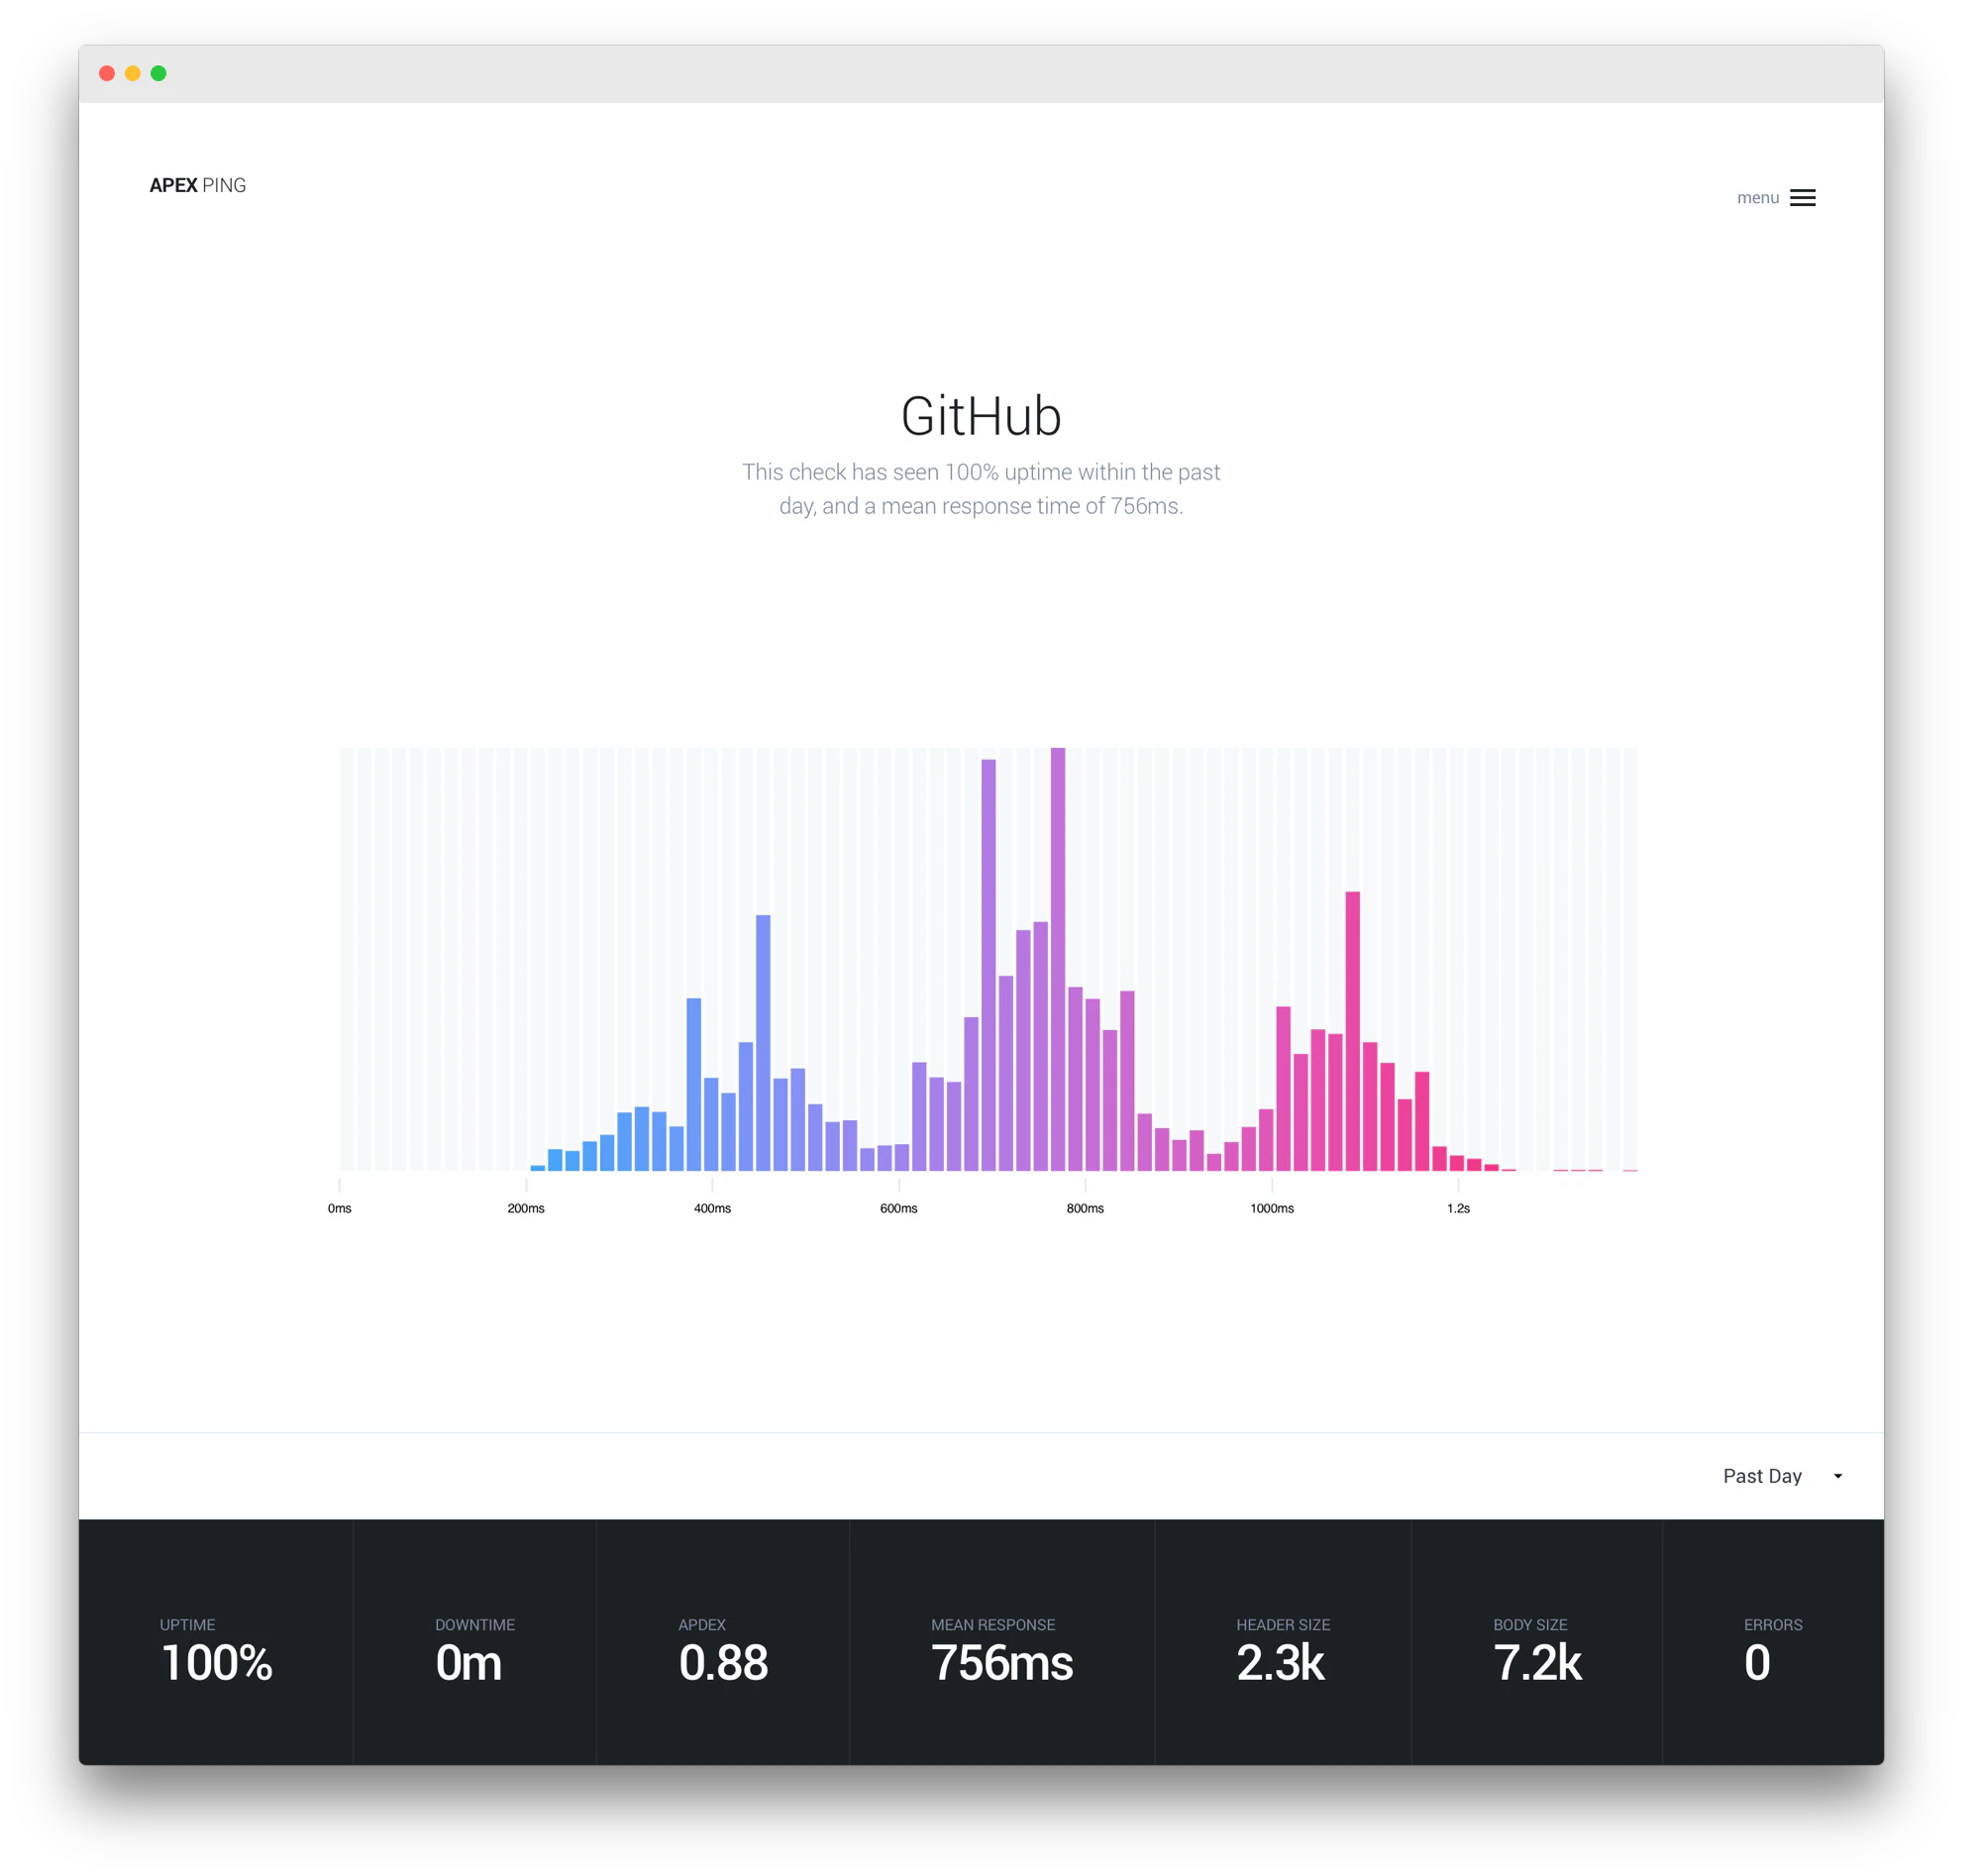
Monitoring for websites, APIs, and cron jobs
2024 · webgazer.io · its alternatives →
- 7

My new project: track your web apps' performance under load without being flooded by email or keeping browser tabs open all day to watch your stats. This is the first Chrome Extension I've written (uses HTML5 localStorage, yay!), and it basically integrates data from NewRelic RPM's API and Hoptoad's API, both great products. Get lightweight notifications (like Growl) in realtime, and track your Apdex score [1] without leaving whatever page you're currently on. https://chrome.google.com/webstore/detail/emencamphkobkmeloepceomcacgejlnc (free!) [1] http://en.wikipedia.org/wiki/Apdex Would love…
2011 · chrome.google.com · its alternatives →
- 8

Hey all, I've been working on this side project to get a Cypress.io-like experience, but for Ruby developers. It's plug-n-play with Capybara system tests, with the following features: - visualize assertions/commands as they happen - view all API requests, errors, and logs in the timeline - pause/continue on any step - rewind through history with a recorded video This is brand new, so looking for people to start trying it out and leave feedback.
2024 · github.com · its alternatives →
- 9AJ
2012 · segmentio.github.com · its alternatives →
- 10

The best way to monitor the performance of your frontend
2022 · launchdarkly.com · its alternatives →
- 11

Monitor Chrome extensions metrics growth
2023 · appwatch.co · its alternatives →
- 12
 APImetrics▲72
Simple, powerful, secure API performance monitoring
2021 · apicontext.com · its alternatives →
- 13
 Lighthouse 8.0▲330
Analyze web apps & sites, collect modern performance metrics
2021 · developer.chrome.com · its alternatives →
- 14

2011 · github.com · its alternatives →
- 15

A chrome extension tracks front-end JavaScript that uses DOM / jQuery APIs to manipulate html dom elements (e.g., change style, attach event listener) at runtime. - pilagod/js-tracker
2018 · github.com · its alternatives →
- 16

The simplest, fastest, & cheapest way to monitor performance
2020 · requestmetrics.com · its alternatives →
- 17RT
2012 · dashboard.graphdat.com · its alternatives →
- 18DC
2018 · maratyszcza.github.io · its alternatives →
- 19
 Redis Dashboard▲194
Visualize your redis instances, analyze query patterns and spikes. - GitHub - nkrode/RedisLive: Visualize your redis instances, analyze query patterns and spikes.
2012 · github.com · its alternatives →
- 20

A beautiful web dashboard for Linux. Contribute to tariqbuilds/linux-dash development by creating an account on GitHub.
2014 · github.com · its alternatives →
- 21

A better way to monitor your Node.js backend
2022 · launchdarkly.com · its alternatives →
- 22SG
2019 · crux.run · its alternatives →
- 23

Performances & exceptions monitoring for Ruby on Rails applications - BaseSecrete/rorvswild
2017 · github.com · its alternatives →
- 24RA
2015 · rbkit.codemancers.com · its alternatives →
Also compare
Ranked by how close each launch is in meaning, then by votes. Prices were read from each product’s own site when checked and can change. Refine with your own description →