Dev tools · alternatives · 2026

24 alternatives to Mode Dashboards
Beautiful new tools for tracking and exploring key metrics
Mode Dashboards is an analytics web application for tracking and exploring key metrics. It provides tools for building and viewing dashboards that visualize data. The platform is designed for developers and analysts… Below are 24 products that do a similar job, ranked by how close each is in meaning and then by launch-day votes. Mode Dashboards launched in 2017; newer entries below may have overtaken it.
- 1
 Mode Analytics▲105
Tools to connect data and the people who analyze it.
2014 · app.mode.com · its alternatives →
- 2

- 3

- 4

Monitor your key metrics, everywhere you go
2016 · apps.apple.com · its alternatives →
- 5

A beautiful way to keep track of anything you want 📊
2018 · fiplab.com · its alternatives →
- 6

The fastest way to actionable user insights
2014 · neilpatel.com · its alternatives →
- 7

Track, visualize, and analyze your time spent online
2021 · chromewebstore.google.com · its alternatives →
- 8
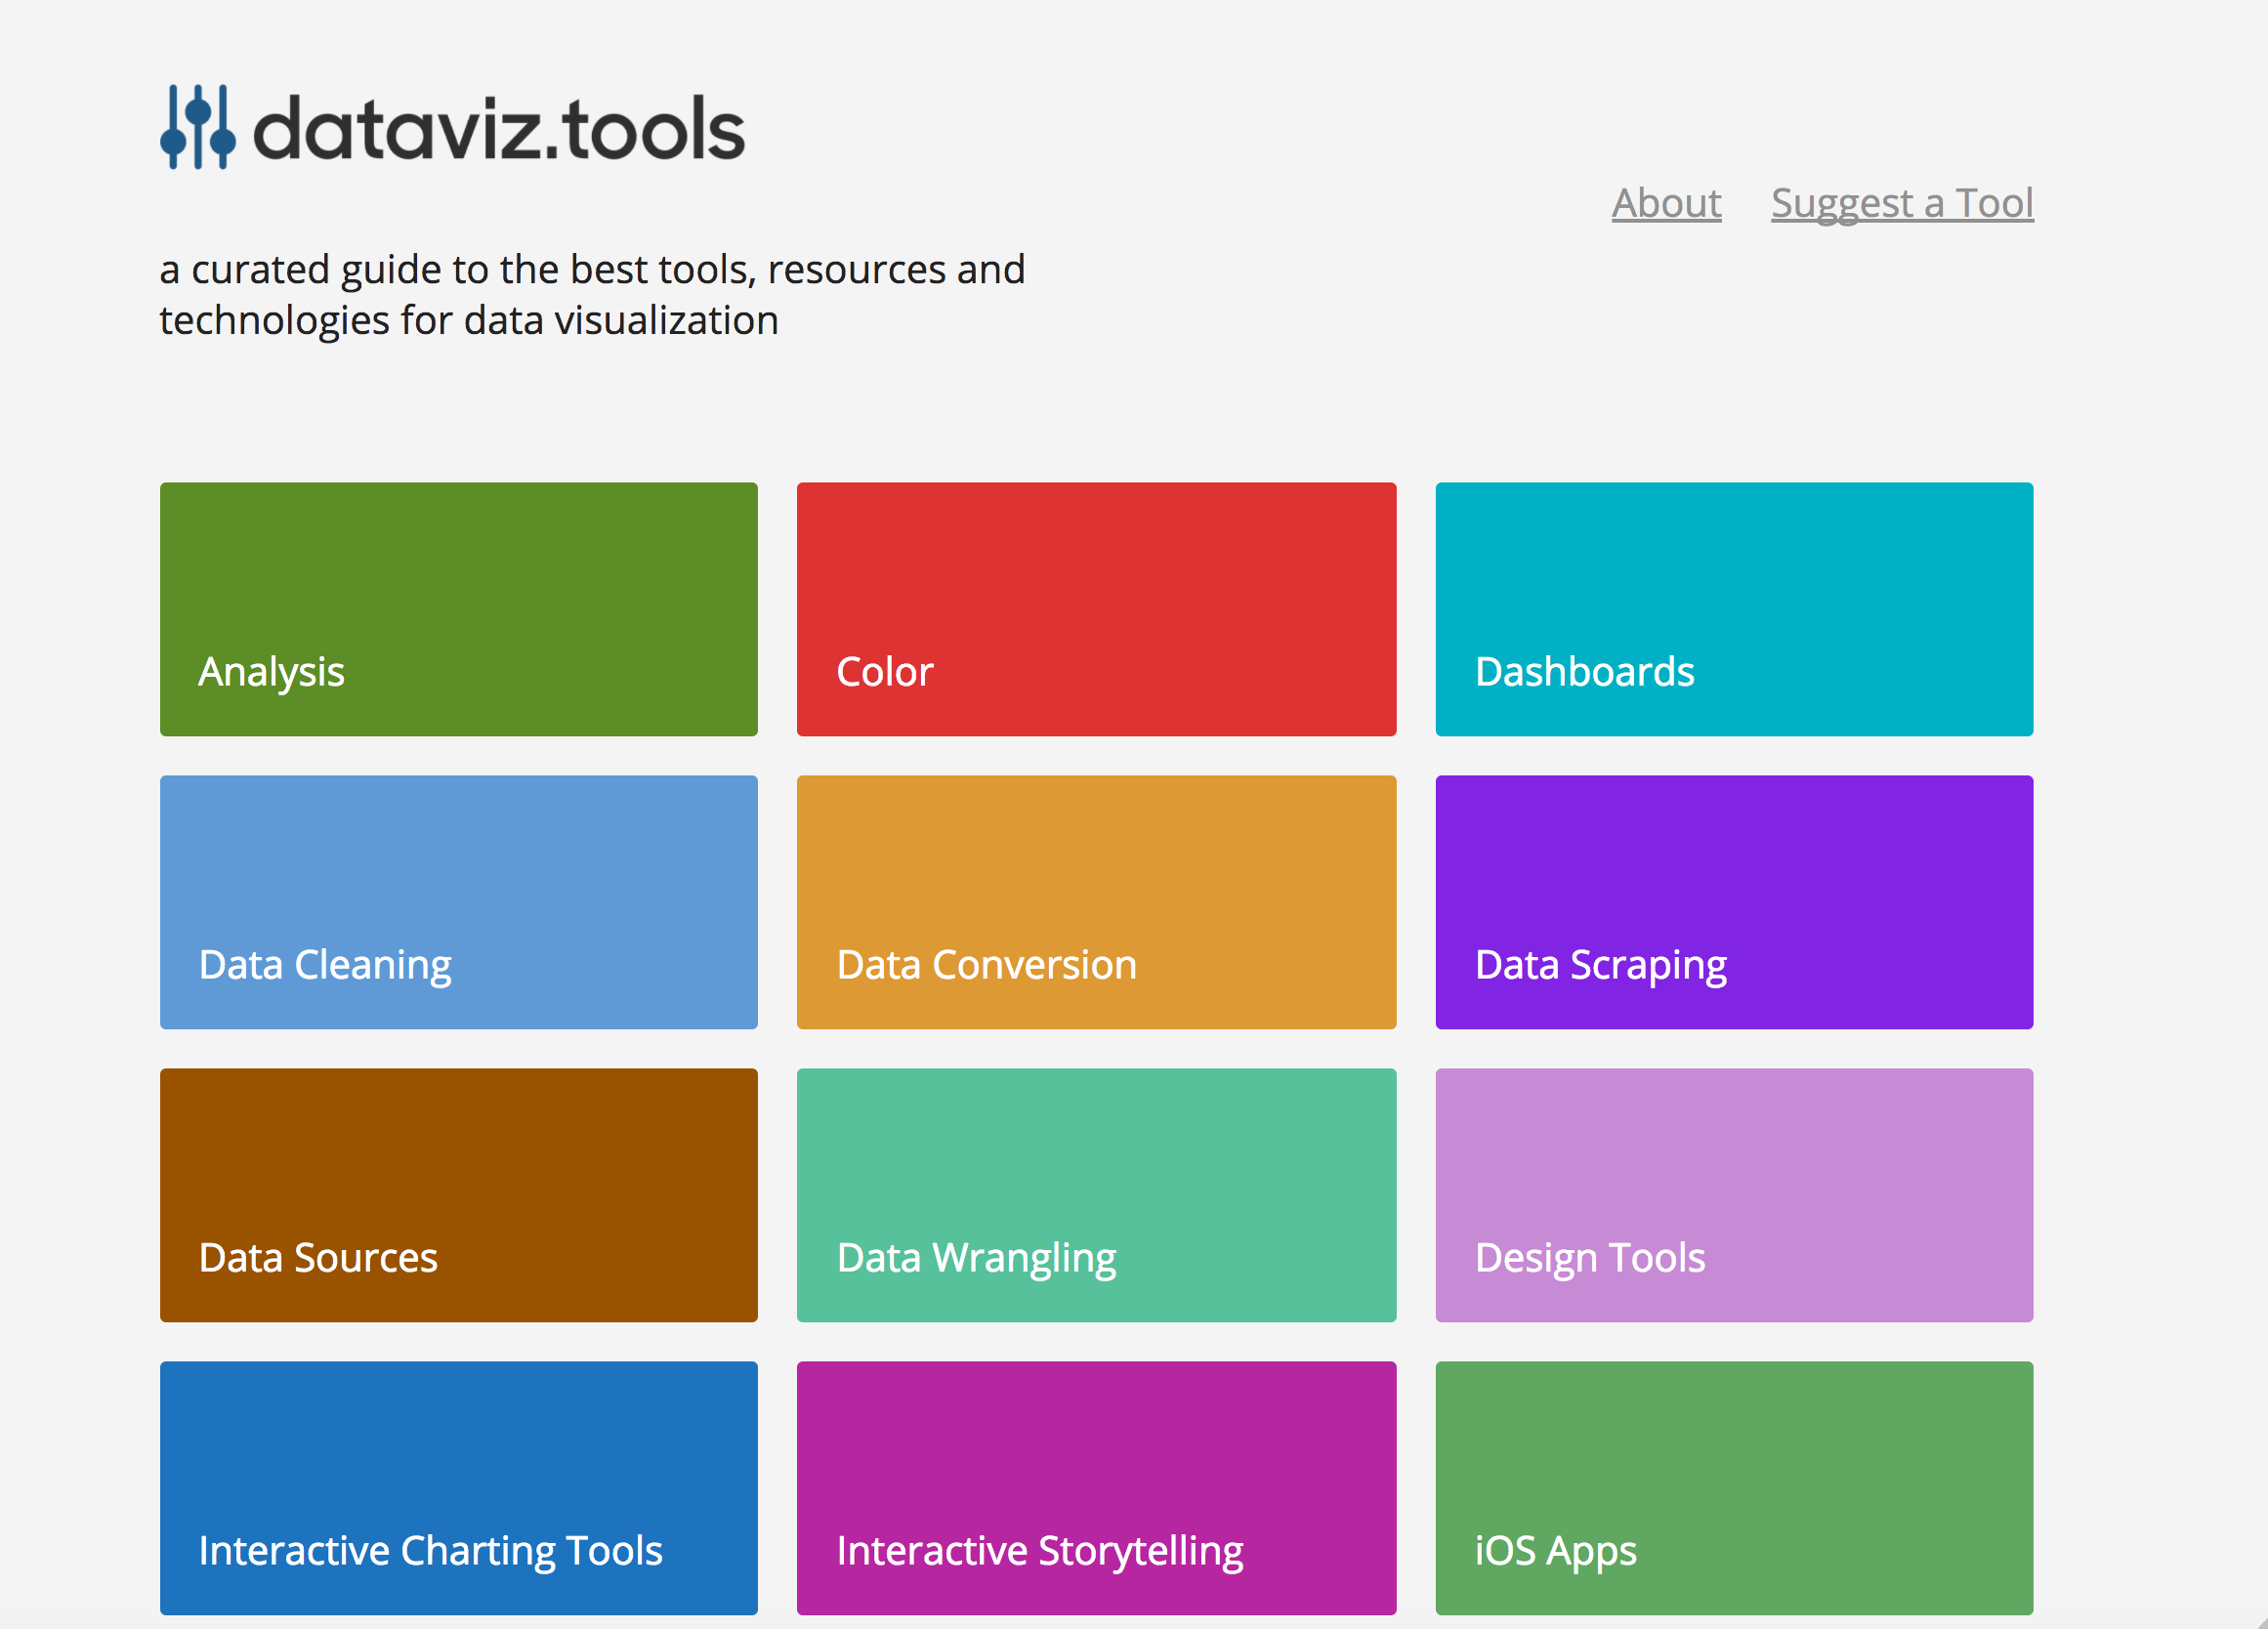 dataviz.tools▲409
Curated collection of the 400 best data visualization tools
2017 · dataviz.tools · its alternatives →
- 9

- 10SD
2014 · freeboard.io · its alternatives →
- 11
 Mode for Slack▲107
Share dashboards and analysis with your team on Slack
2016 · mode.com · its alternatives →
- 12

- 13GD
2012 · glancedat.com · its alternatives →
- 14
 Browsing Mode▲141
Online space for exceptional website designs
2024 · browsingmode.com · its alternatives →
- 15WA
2020 · deathofdashboards.com · its alternatives →
- 16

Track the numbers that matter most
2024 · cynapse.com · its alternatives →
- 17
 MetricMap▲92
Track revenue, ads, web vitals, & user insights in one hub
Mar 2026 · metricmap.app · its alternatives →
- 18

A beautiful web dashboard for Linux. Contribute to tariqbuilds/linux-dash development by creating an account on GitHub.
2014 · github.com · its alternatives →
- 19
 Mode Definitions▲109
Reusable, SQL-based business logic you can COUNT() on
2016 · mode.com · its alternatives →
- 20
 Dashi Metrics▲192
A full-screen ambient analytics globe with live numbers, chill music, and vibes. Leave it open all day — not another SaaS dashboard.
Aug 2026 · dashimetrics.com · its alternatives →
- 21

- 22

2021 · volmarg.github.io · its alternatives →
- 23

TV dashboards that make your most important metrics visible
2020 · geckoboard.com · its alternatives →
- 24WB
Most analytics tools give you 10–15 chart types and call it a day. But what happens when none of them actually represent your data well? We ran into this when building a CRM dashboard. We wanted to show how sales reps connect to open deals: not just totals, but actual relationships. A bar chart was too flat, a table too dense. We needed a network graph. The problem? Most chart libraries and BI tools don’t support that out of the box. You either say “no” to the feature request, or you hack together a standalone visualization that breaks the product’s flow (no filters, no interactivity, no…
Oct 2025 · its alternatives →
Also compare
Ranked by how close each launch is in meaning, then by votes. Prices were read from each product’s own site when checked and can change. Refine with your own description →