Alternatives
Products that do what OIDC/OAuth Devtool Extension does
Debug, and learn OIDC/OAuth.
- 1OD
Effortlessly discover API behaviour with a Chrome extension that automatically generates OpenAPI specifications in real time for any app or website.
2023 · github.com
- 2

- 3

- 4

- 5

- 6

- 7

- 8

- 9AC
2014 · devtoolstips.com
- 10

- 11

- 12

- 13ID
2020 · inspect.dev
- 14

- 15IW
2021 · github.com
- 16SD
2024 · github.com
- 17QD
Hi HN, I'm Tyler Flint. Eight months ago we shared qtap here (https://news.ycombinator.com/item?id=43928118). Today we're releasing DevTools - a browser-based interface that gives you the Chrome Network tab experience for server-side HTTP/S traffic. The problem: You're debugging a production issue. An external dependency is returning errors. Your logs say "request failed" but not what was actually sent. Adding debug logging means redeploying and restarting services - which takes time and often changes the conditions you're trying to debug. tcpdump shows encrypted blobs.…
Jan 2026 · qpoint.io
- 18

JSON, Regex, JWT, Markdown and more — all in one toolbox
Mar 2026 · quan1229.com
- 19
- 20DK
2020 · chromeextensionkit.com
- 21
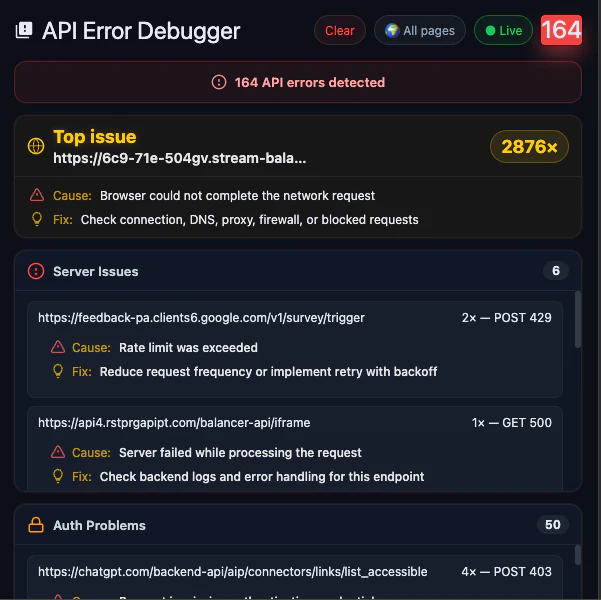
Debug API errors in Chrome without digging through DevTools
Apr 2026 · api-error-debugger.soft-core.dev
- 22

- 23FC
2019 · rahulrav.svbtle.com
- 24IB
Hi HN! I've been working on developer tools for Blazor that let you inspect Razor components in the browser, similar to React DevTools or Vue DevTools. The problem: Blazor is Microsoft's frontend framework that lets you write web UIs in C#. It's growing fast but lacks the debugging tools other frameworks have. When your component tree gets complex, you're stuck with Console.WriteLine debugging. What I built: A browser extension + NuGet package that: Shows the Razor component tree in your browser Maps DOM elements back to their source components Highlights components on hover Works with both…
Oct 2025 · blazordevelopertools.com
Ranked by how close each launch is in meaning, then by votes. Refine with a description →