nowfound

Dev tools · alternatives · 2026

24 alternatives to QueryTree

Straightforward data reporting and visualization

Below are 24 products that do a similar job, ranked by how close each is in meaning and then by launch-day votes. QueryTree launched in 2017; newer entries below may have overtaken it.

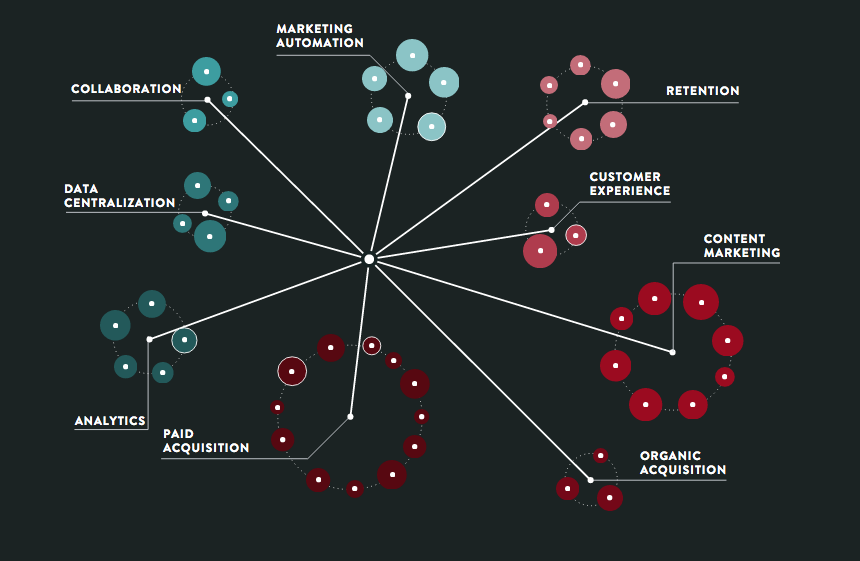
  1. 1

    An interactive visualization of marketing tech tools

    2015 · growthverse.com · its alternatives →

  2. 2
    Datamatic▲156

    Editable data visualizations for the web

    2017 · datamatic.io · its alternatives →

  3. 3
    Data Deck▲118

    All your data → beautiful, real-time dashboard

    2016 · datadeck.com · its alternatives →

  4. 4
    Beam▲149

    Tell your stories with beautiful charts

    2016 · beam.venngage.com · its alternatives →

  5. 5
    Datapad▲83

    Beautiful visual analytics

    2014 · datapad.io · its alternatives →

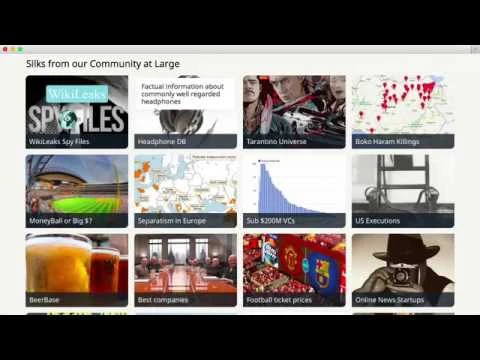
  6. 6
    Silk 2.0▲135

    Publish data online and create interactive visualizations

    2015 · its alternatives →

  7. 7

    A simple service for curating and sharing great content

    2015 · embedtree.com · its alternatives →

  8. 8

    The data community's workbench

    2018 · its alternatives →

  9. 9
    Charted▲233

    Beautiful, automatic charts (from Medium)

    2014 · charted.co · its alternatives →

  10. 10

    Analytics, sans dashboard.

    2017 · academicconsultant.co · its alternatives →

  11. 11

    Subscription analytics and insights for Braintree & Recurly

    2016 · baremetrics.com · its alternatives →

  12. 12

    Live, interactive reports and dashboards for Google data

    2016 · cloud.google.com · its alternatives →

  13. 13

    Powerful AI-based data searching and system monitoring tool

    2025 · queryinside.com · its alternatives →

  14. 14
    Forestry▲187

    A lightweight CMS for Jekyll and Hugo sites

    2016 · tina.io · its alternatives →

  15. 15
    Revup▲57

    Subscription Analytics for Braintree

    2015 · its alternatives →

  16. 16
    Silk 1.5▲133

    Publish data online and create interactive visualizations

    2014 · its alternatives →

  17. 17

    The Business Graph

    2014 · crunchbase.com · its alternatives →

  18. 18
    treev▲161

    A search bar for your Google docs, Dropbox, Trello & more

    2015 · treev.co · its alternatives →

  19. 19

    Analytics For The Visual Web

    2014 · bazaarvoice.com · its alternatives →

  20. 20

    Video-based wiki where subjects are hierarchically organized

    2016 · its alternatives →

  21. 21
    Levers▲95

    Forecasted Dashboards for Google Analytics

    2014 · its alternatives →

  22. 22

    An all-purpose tool for data journalism

    2015 · its alternatives →

  23. 23

    Build powerful data visualizations for the web.

    2014 · variancecharts.com · its alternatives →

  24. 24

    Data analysts training data analysts

    2014 · sqlschool.modeanalytics.com · its alternatives →

Also compare

Ranked by how close each launch is in meaning, then by votes. Prices were read from each product’s own site when checked and can change. Refine with your own description →