Dev tools · alternatives · 2026

24 alternatives to Tractorscope
The developer’s data visualization platform
Below are 24 products that do a similar job, ranked by how close each is in meaning and then by launch-day votes. Prices are shown for the 1 we have checked on their own sites, 1 of them free or with a free tier. Tractorscope launched in 2024; newer entries below may have overtaken it.
- 1
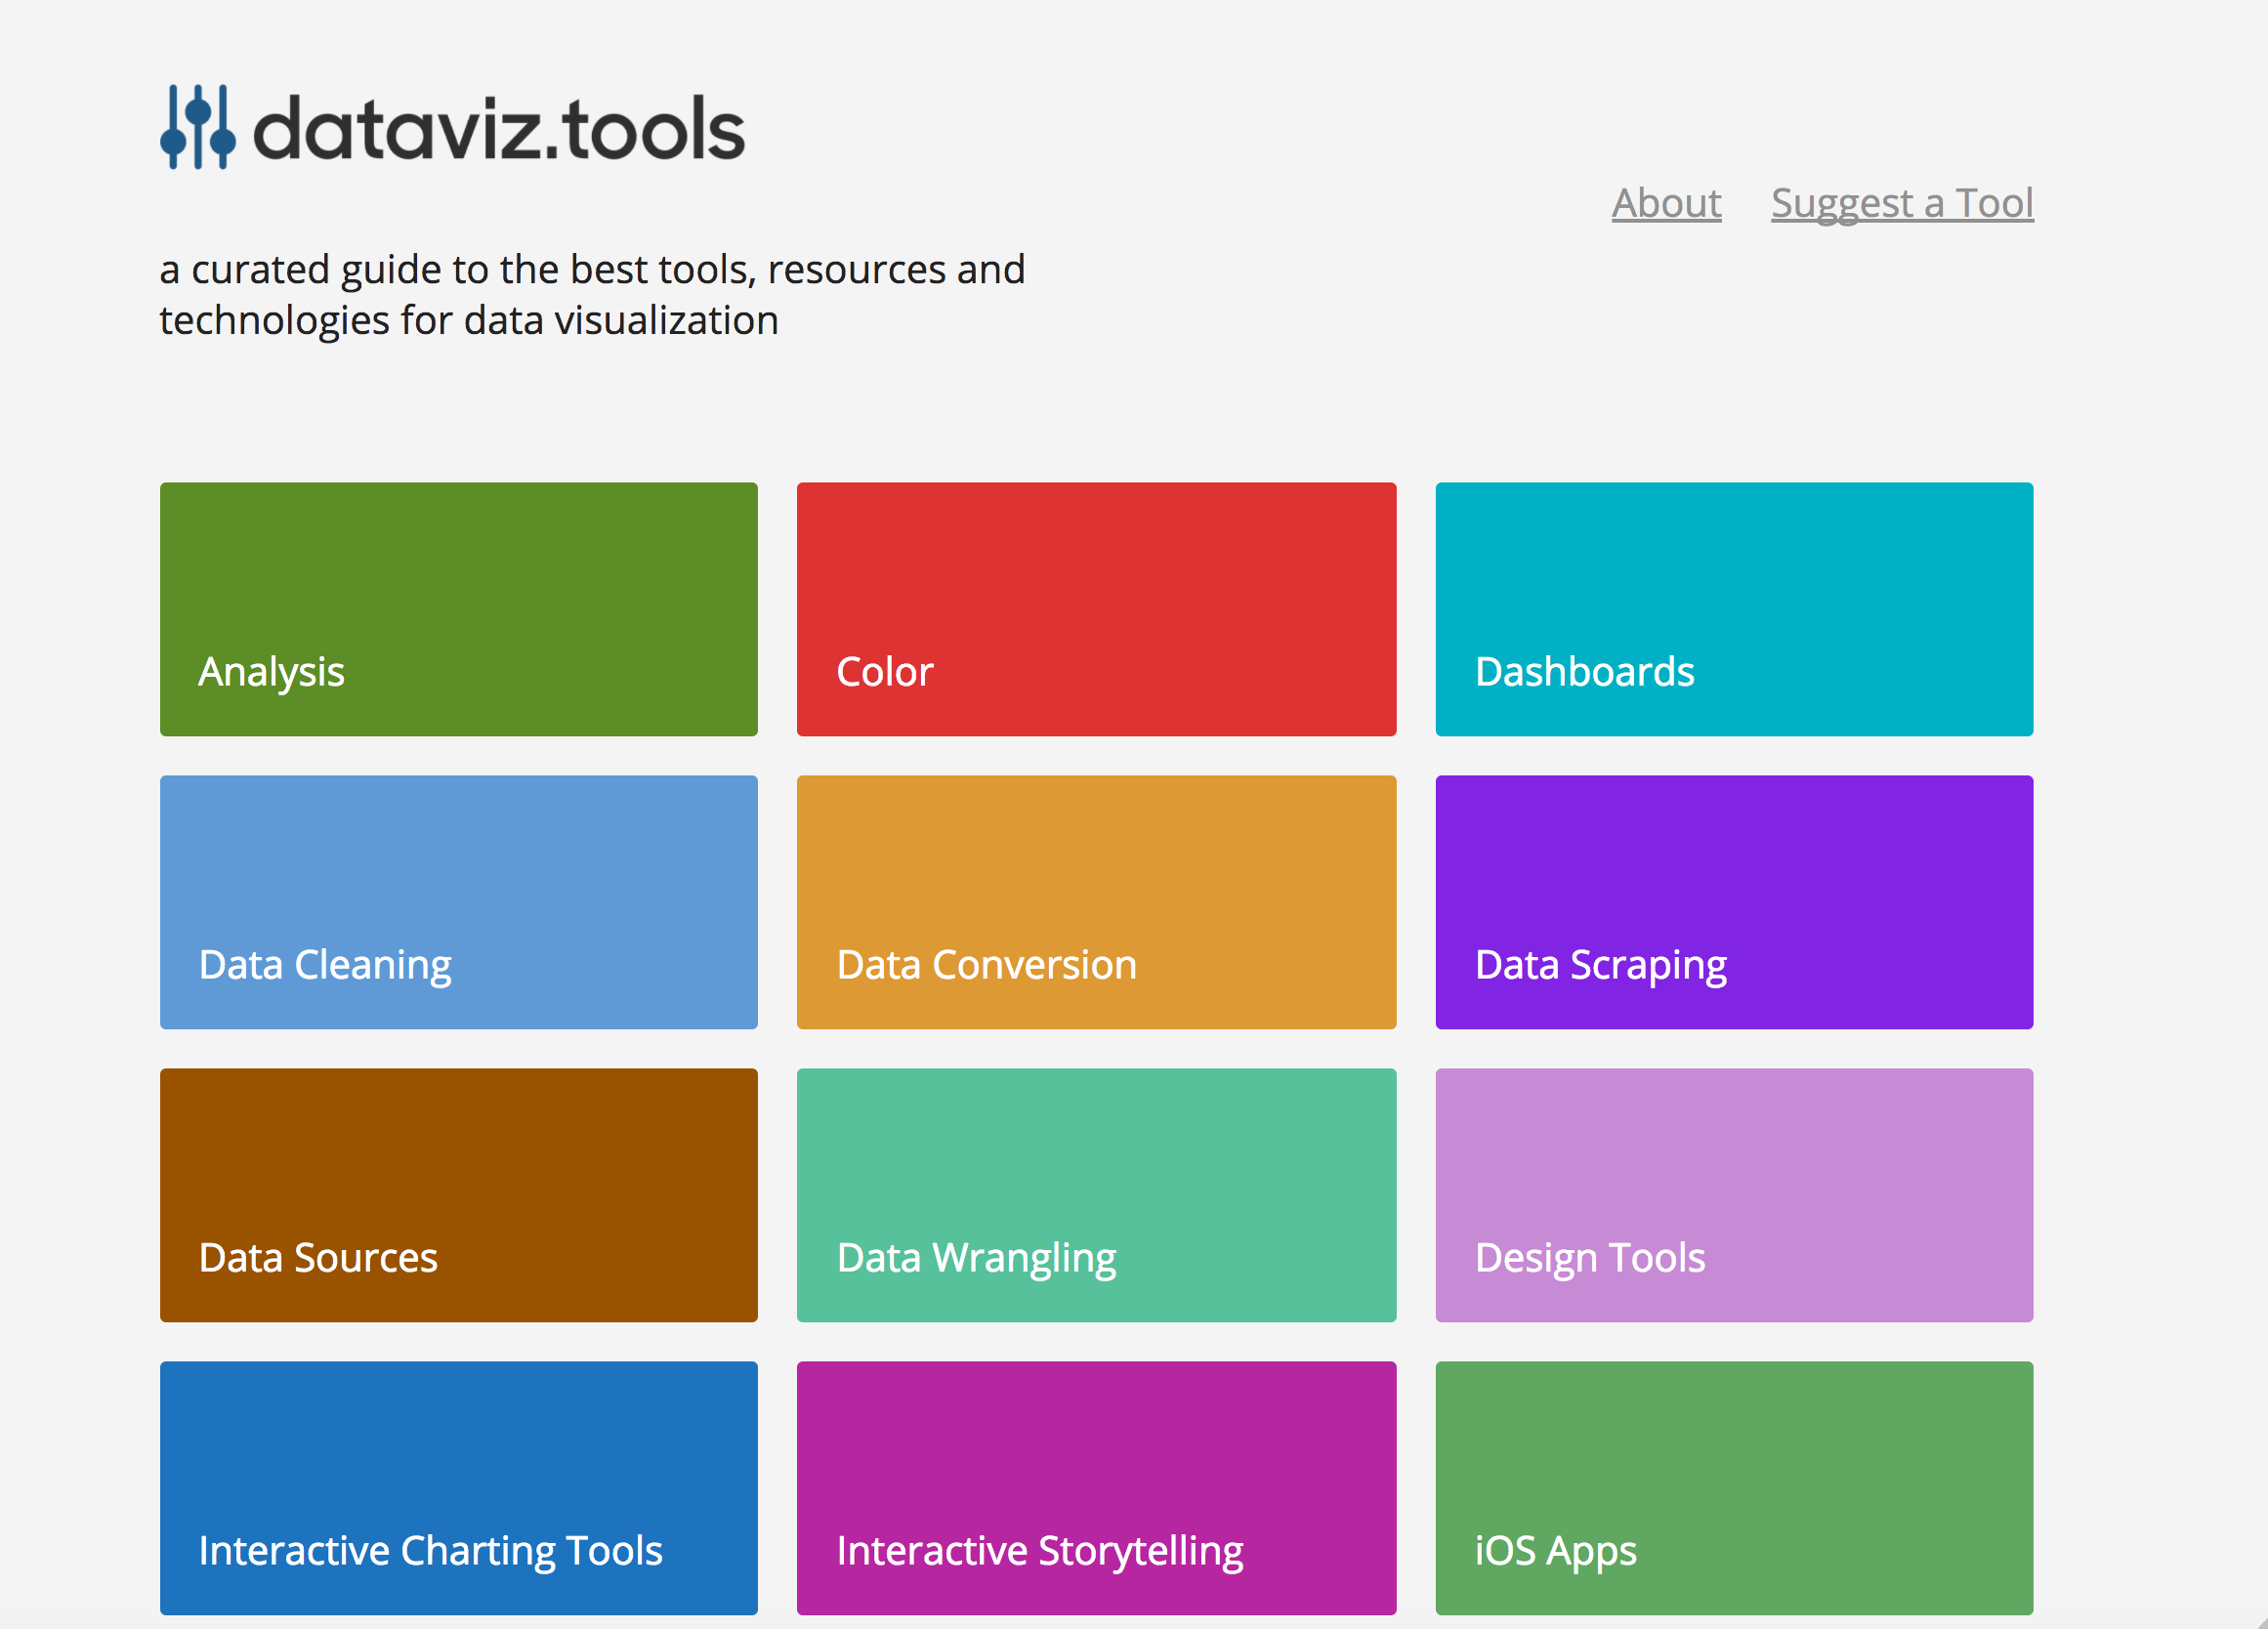 dataviz.tools▲409
Curated collection of the 400 best data visualization tools
2017 · dataviz.tools · its alternatives →
- 2

- 3
 DevLake▲188
An open-source data-lake & dashboard for your dev tools
2021 · github.com · its alternatives →
- 4
 Redis Dashboard▲194
Visualize your redis instances, analyze query patterns and spikes. - GitHub - nkrode/RedisLive: Visualize your redis instances, analyze query patterns and spikes.
2012 · github.com · its alternatives →
- 5TL
2018 · charts.com · its alternatives →
- 6

Agentic data platform for robotics. Collect, triage and debug fleet data, search every run, and curate datasets to train your next model. Free to start.
2021 · foxglove.dev · its alternatives →
- 7DA
Dear HN, I am Riwaj, the cofounder of dstack.ai (https://github.com/dstackai). A few months ago, we built an online service that allows users to publish data visualizations from Python or R. The idea was to build a tool that did not require additional programming or front-end development for publishing data visualizations. Such a code can be invoked from either Jupyter notebook, RMarkdown, Python, or R scripts. Once the data is pushed, it can be accessed via a browser. Open-sourcing dstack: During our customer discovery phase, we realized that dstack.ai should integrate a lot…
2020 · its alternatives →
- 8

Creating data visualizations with AI nowadays often means chat, chat and more chats...and writing long prompts can be annoying while they are also not the most effective way to describe your visualization designs. Data Formulator blends UI interaction with natural language so that you can create visualizations with AI much more effectively! You can: * create rich visualizations beyond initial datasets, where AI helps transforming and visualizing data along the way * iterate your designs and dive deeper using data threads, a new way to manage your conversation with AI. Here is a demo video:…
2024 · github.com · its alternatives →
- 9

- 10LV
2016 · alooma.com · its alternatives →
- 11

- 12

- 13
- 14

- 15
 Databerry▲114
Track all your business data in a single dashboard
May 2026 · databerry.app · its alternatives →
- 16

- 17

App to easily query, script, and visualize data from every database, file, and API. - multiprocessio/datastation
2022 · github.com · its alternatives →
- 18

Reference tool for data visualisation
2016 · datavizcatalogue.com · its alternatives →
- 19

Learn how to use this simple free tool dbdiagram.io to visualize your Rails ERD diagram, made by Holistics
2018 · holistics.io · its alternatives →
- 20

- 21

Charts and infographics constructor in Figma
2021 · store.123d.one · its alternatives →
- 22

A grid library for instant big data processing
2022 · datatable.dev · its alternatives →
- 23

- 24

Also compare
Ranked by how close each launch is in meaning, then by votes. Prices were read from each product’s own site when checked and can change. Refine with your own description →