Dev tools · alternatives · 2026

24 alternatives to Visualize user behaviour with heatmap.js
An easy to use, open source, data visualization library to help you create beautiful heatmaps for your projects
Heatmap.js is an open source data visualization library that enables developers to create heatmaps for web projects. It works with multiple mapping libraries including Leaflet and Google Maps, providing flexibility in… Below are 24 products that do a similar job, ranked by how close each is in meaning and then by launch-day votes. Visualize user behaviour with heatmap.js launched in 2014; newer entries below may have overtaken it.
- 1

- 2
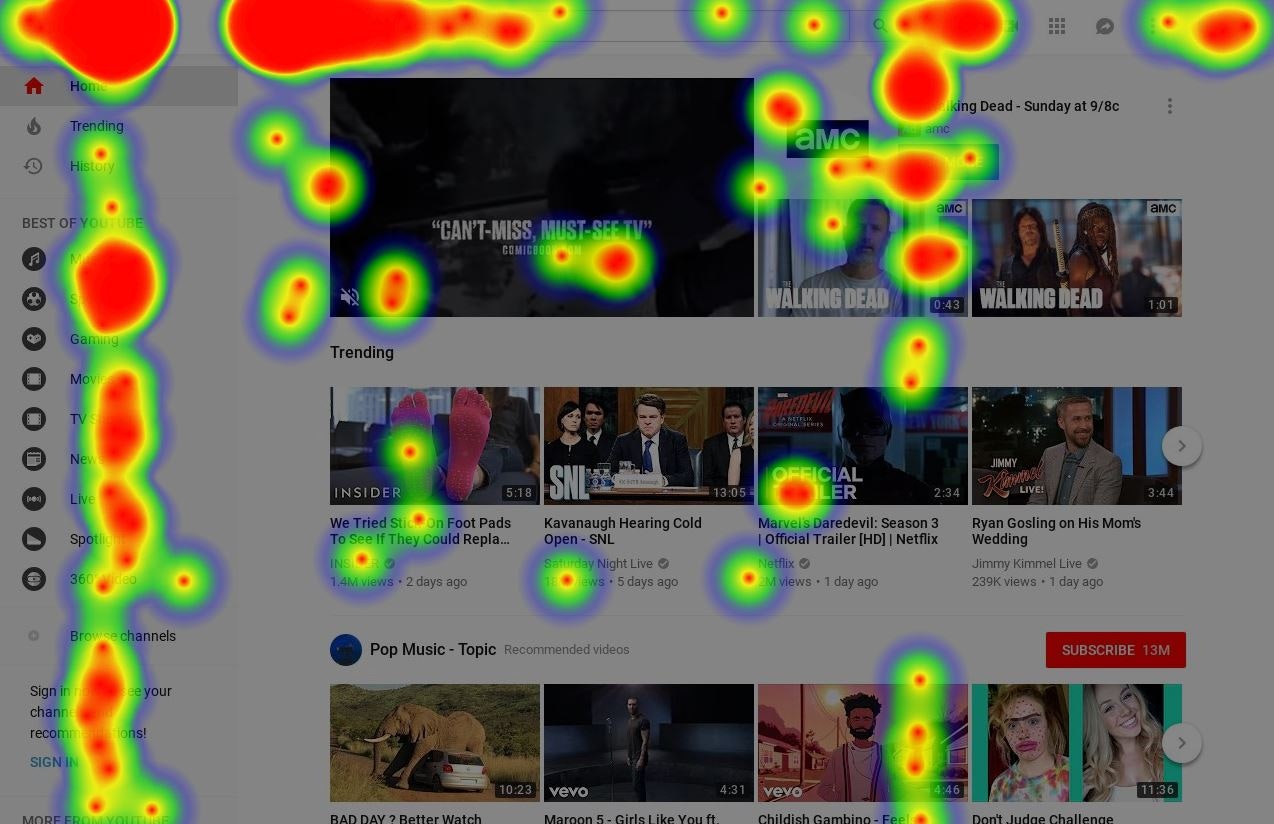
Any website's heatmap data is at your fingertips
2018 · its alternatives →
- 3

Visualise a git repository by diff activity. Contribute to jmforsythe/Git-Heat-Map development by creating an account on GitHub.
2023 · github.com · its alternatives →
- 4
 Chart.js▲263
Simple, clean & engaging charts for designers and developers
2014 · chartjs.org · its alternatives →
- 5

Pts is a javascript library for visualization and creative-coding.
2018 · ptsjs.org · its alternatives →
- 6TJ
A JavaScript Library for creating SVG patterns
2015 · riccardoscalco.github.io · its alternatives →
- 7
 Chart.js 2.0▲440
Simple, clean & engaging charts for designers & developers.
2016 · chartjs.org · its alternatives →
- 8

- 9
 Chart.js 4.0▲111
Open source JavaScript charting library for the modern web
2022 · github.com · its alternatives →
- 10
 VisualSitemaps▲512
Autogenerate visual sitemaps in seconds.
2019 · visualsitemaps.com · its alternatives →
- 11

Turn your spreadsheets into beautiful map visualizations
2024 · postcodeheatmap.com · its alternatives →
- 12

Many JS libraries exist to build graphs on the web (Vega, chartJS, Plotly...). They allow to make charts quickly. But you lose flexibility: you're limited by the options they offer. I just created a gallery with hundreds of graphs made with d3.js and React. - Examples are split by graph types - They all come with explanation and code sandboxes - Gradual complexity to ease the learning curve It took me ages to create this project! Feedback welcome!
2023 · react-graph-gallery.com · its alternatives →
- 13

map33.js is a JavaScript library to build 3D maps. Made by Openbloc with three.js.
2020 · map33.openbloc.com · its alternatives →
- 14TL
2018 · charts.com · its alternatives →
- 15GJ
Grid.js is a lightweight JavaScript table plugin that works on all web browsers and devices. Grid.js is open-source and it helps you create advanced tables in seconds!
2020 · gridjs.io · its alternatives →
- 16

Heatmap Animator is a javascript web application that makes it possible to record and display heatmap sessions.
2012 · patrick-wied.at · its alternatives →
- 17
 AnyMap▲176
Create stunning interactive JavaScript/HTML5 maps from data.
2017 · anychart.com · its alternatives →
- 18

Keyboard Heatmap Visualization showing character distribution on different keyboard layouts while you
2011 · patrick-wied.at · its alternatives →
- 19RC
2011 · bench.nowjs.org · its alternatives →
- 20
 Heatbot.io▲263
Generate improved websites from heatmaps with AI
2024 · heatbot.io · its alternatives →
- 21
 Vizzu▲225
Open-source JS library to build animated charts with ease
2022 · vizzu.io · its alternatives →
- 22

Visualize Google location history data on a heatmap 🗺️
2018 · locationhistoryvisualizer.com · its alternatives →
- 23

Globe wireframe visualizations in Golang. Contribute to mmcloughlin/globe development by creating an account on GitHub.
2017 · github.com · its alternatives →
- 24

GitHub Gist: instantly share code, notes, and snippets.
2013 · bl.ocks.org · its alternatives →
Also compare
Ranked by how close each launch is in meaning, then by votes. Prices were read from each product’s own site when checked and can change. Refine with your own description →