Life & fun · alternatives · 2026
24 alternatives to Vs Graphs. Visually compare products and more
Below are 24 products that do a similar job, ranked by how close each is in meaning and then by launch-day votes. Vs Graphs. Visually compare products and more launched in 2020; newer entries below may have overtaken it.
- 1

- 2

Visualize boring data into beautiful charts & graphs.
2017 · visme.co · its alternatives →
- 3

- 4
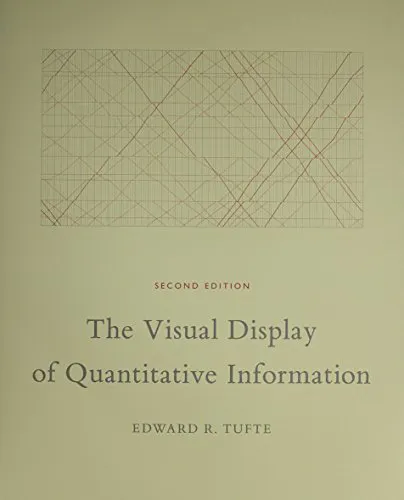
The bible for people interested in presenting information
2015 · amazon.com · its alternatives →
- 5VG
2020 · treksit.netlify.app · its alternatives →
- 6

- 7
 Variance▲91
Build powerful data visualizations for the web.
2014 · variancecharts.com · its alternatives →
- 8
 Product Chart▲118
Interactive comparison charts of laptops, smartphones & more
2015 · productchart.com · its alternatives →
- 9GA
Hi everyone! Graphs is the intersection of data visualization and the daily web puzzle genre (Wordle, NYT Mini Crossword, Connections, etc.). Every day, you are given a nameless graph and 5 options to select the right dataset it is representing. Upon winning, you can access the underlying dataset and other info + maintain a streak and stats. It's super simple - check out today's chart and you should be able to get the gist quickly. My email + twitter account (@graphsgame) is on the page, would love a feedback or a follow. Don't hesitate to reach out!
2024 · graphs.world · its alternatives →
- 10

The future of online data visualization tools
2016 · policyviz.com · its alternatives →
- 11

- 12

- 13

- 14

- 15CY
2016 · cluelet.com · its alternatives →
- 16

- 17

- 18

- 19ND
2014 · blog.spritesapp.com · its alternatives →
- 20

2014 · comparea.org · its alternatives →
- 21

Seamless Visual QA: Compare, Detect, Highlight Changes
2025 · pypi.org · its alternatives →
- 22US
2015 · imaginea.github.io · its alternatives →
- 23

Interactive visualisations help explain Depth First Search and Breadth First Search as well as algorithms based upon each approach. A very useful resource for learning by seeing.
2016 · workshape.github.io · its alternatives →
- 24

2024 · peoplegraphmaker.com · its alternatives →
Also compare
Ranked by how close each launch is in meaning, then by votes. Prices were read from each product’s own site when checked and can change. Refine with your own description →