
Mind the Graph
Create Beautiful Science Infographics
Mind the Graph launched on May 19, 2017 with 6 votes, #1,442 of 3,229 launches that month. The site was still online in September 2026, 9 years on.
What it does
Visually appealing figures for your research. Browse through 40,000+ scientifically accurate illustrations in 80+ popular fields.
Browse through 75.000+ scientifically accurate illustrations in 80+ popularfrom mindthegraph.com
Does a similar job
all alternatives →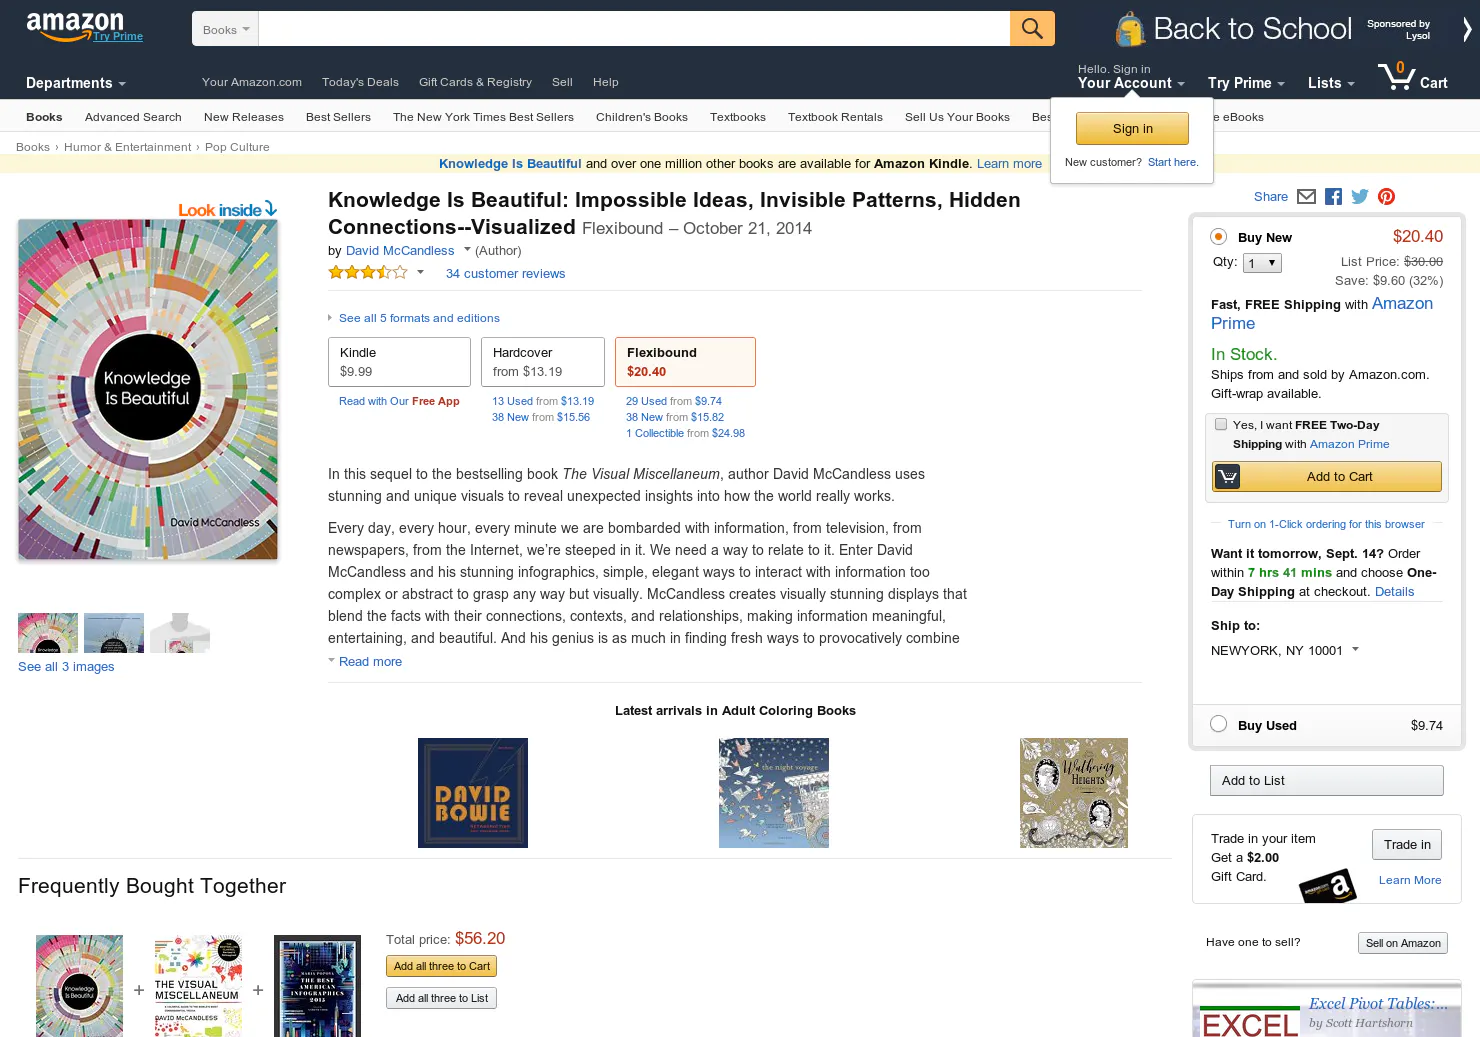 Knowledge is Beautiful2014 · amazon.com · ▲97
Taking infographics & data-visualisation next level (book)




More work this month
the category →

Endless lofi beats composed live in your browser, over pixel-art nights in Paris, Tokyo, New York, Hong Kong, Sydney, San Francisco and more. Free, no sign-up.
Work · 30d ago · loficities.com
 Smooth Recorder▲257
Mac screen recordings that look edited when you hit stop
Work · 24d ago · smoothrecorder.com


Work · 18d ago · readrare.com
Source: Product Hunt launch ↗
Launched alongside, May 2017
the whole month →


 Things 3.0▲757
Complete revamp of the original, award-winning task manager
Work · 2017 · culturedcode.com