RawGraphs
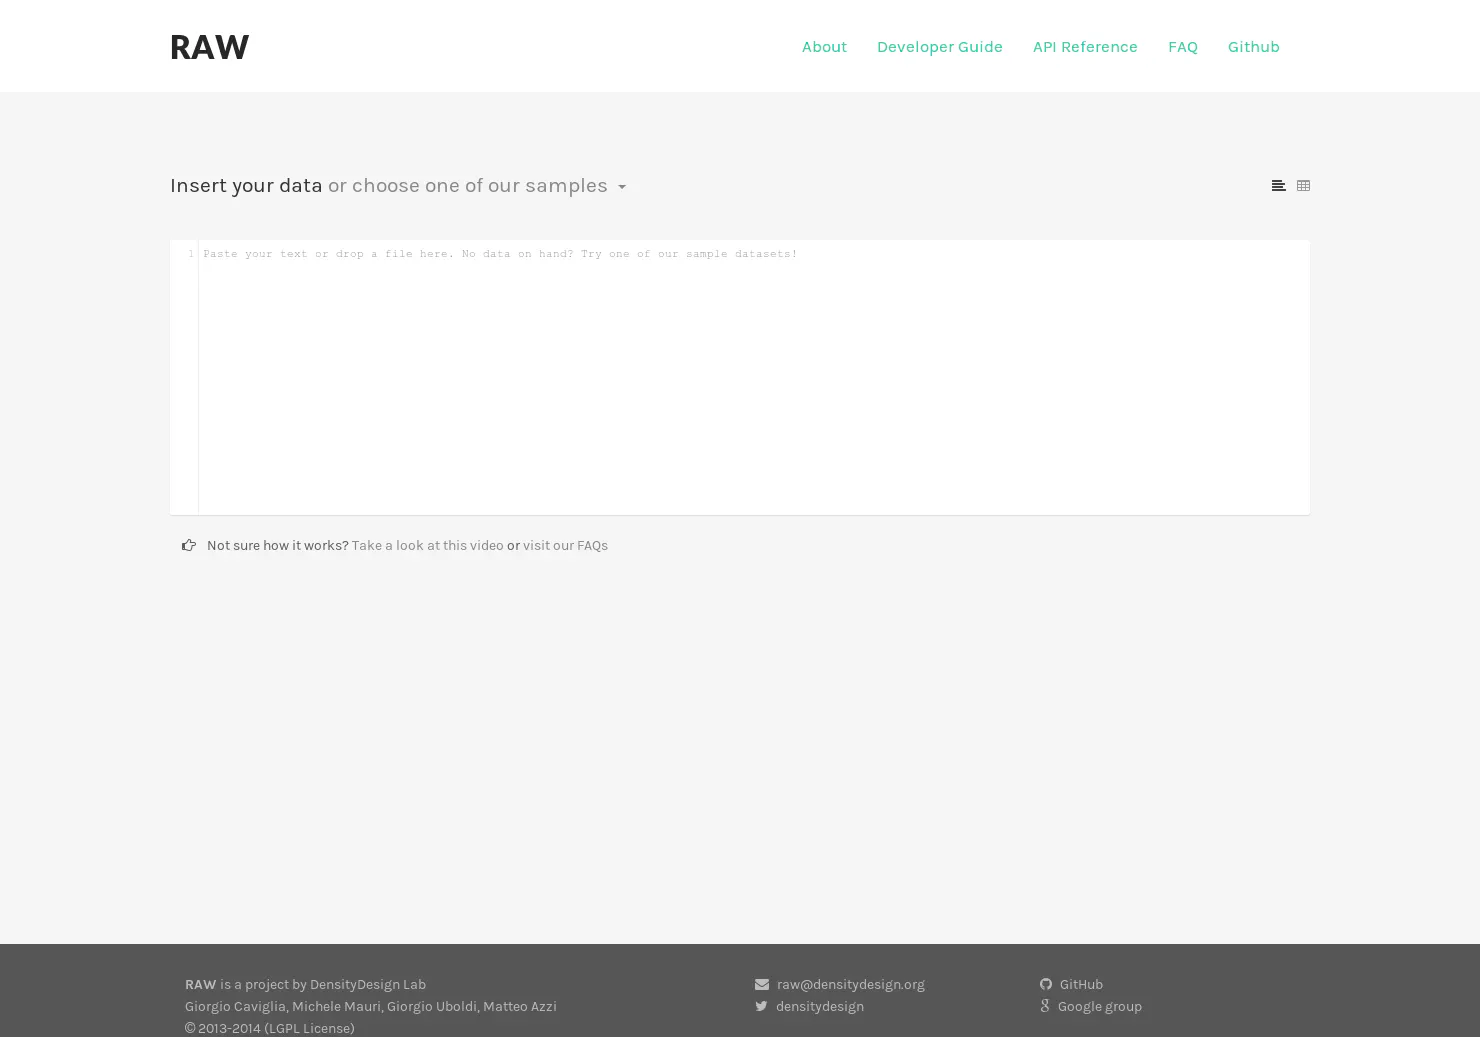
Turn your spreadsheets into data visualization.
RawGraphs launched on March 14, 2017 with 8 votes, #1,166 of 3,481 launches that month and more than 50% of that year's launches. The site was still online in September 2026, 9 years on.
What it does
A free and open source tool for data visualization.
Inspired by and built on top of open source projects. RAWGraphs is open to the community for contributions. Almost 30 visual models to visualize quantities, hierarchies, time series and find insights in your data. Even though RAWGraphs is a web app, the data you insert will be processed only by your web browser. Save your project, or export it as vector or raster image. Edit it within your favouritefrom rawgraphs.io
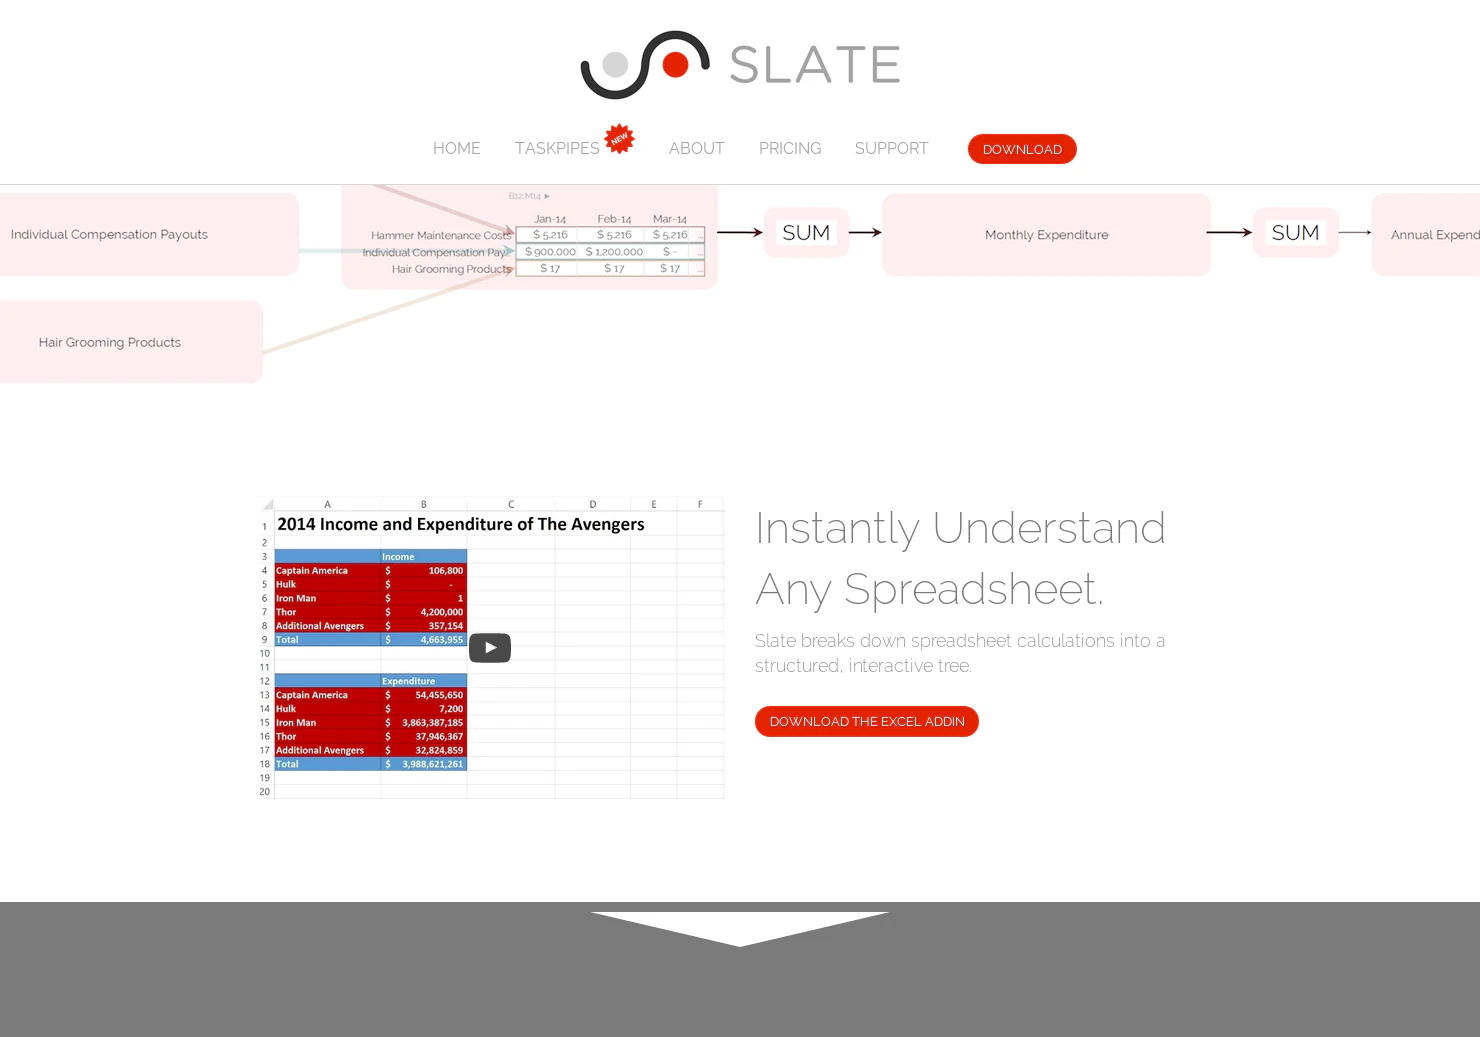
Does a similar job
all alternatives →



More growth this month
the category →
wallhop is a free paywall bypass. Paste any article link to read it without paywall popups, ads or clutter. No signup, no extension. A simple 12ft.io alternative.
Growth · 11d ago · wallhop.io


Source: Product Hunt launch ↗
Launched alongside, March 2017
the whole month → Startup School▲1,010
A free online program to teach you how to start a company
Life & fun · 2017 · startupschool.org

 Hardbound 3.0▲739
Illustrated summaries of bestselling nonfiction books
Life & fun · 2017 · apps.apple.com