Ultimaps — Color Coded Maps
Create Beautiful and Interactive Map Charts in Seconds
Ultimaps — Color Coded Maps launched on December 8, 2024 with 13 votes, #1,204 of 5,365 launches that month and more than 50% of that year's launches. The site was still online in September 2026, 1 year on.
What it does
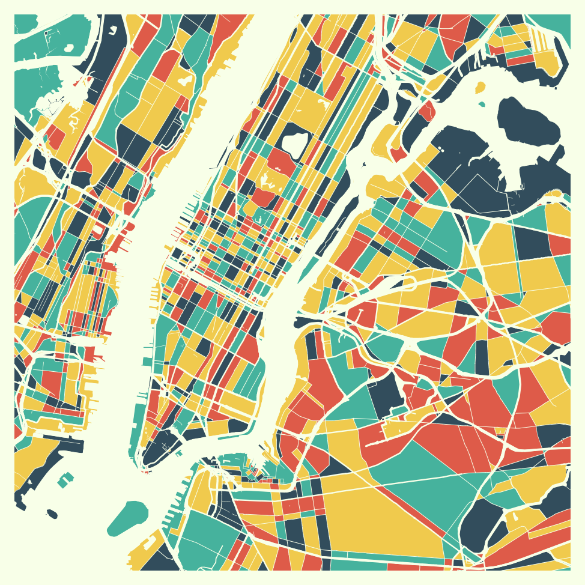
Create color-coded maps and charts from Excel files or AI prompts in seconds. Maps can be exported into a printable format or extended with interactive elements and shared via link or embedded onto a website.
Create choropleth maps, sales territory maps, and interactive embeds from your spreadsheet data. No sign-up required. Export PNG, SVG, PDF. Free plan.
Import from Excel or Google Sheets, color-code regions with your data, and export as high-res PNG, SVG, or an interactive map you can embed anywhere. All in your browser. SO easy to use. Perfect for simple color-coding with the shades I prefer. The AI feature was outstanding...thank you for the great website. This is a great educational resource. I was able to label my surrounding counties for a quick geography lesson with the kids. So easy! I've been looking everywhere for a map app like this From sales teams to researchers, thousands of professionals use Ultimaps to visualize their data on a map. Here are the most popular use cases. Divide states, counties, or countries into territories.…from ultimaps.com
Does a similar job
all alternatives →

 Postcodeheatmap2024 · postcodeheatmap.com · ▲89
Turn your spreadsheets into beautiful map visualizations


More work this month
the category →
Endless lofi beats composed live in your browser, over pixel-art nights in Paris, Tokyo, New York, Hong Kong, Sydney, San Francisco and more. Free, no sign-up.
Work · 26d ago · loficities.com
 Smooth Recorder▲257
Mac screen recordings that look edited when you hit stop
Work · 20d ago · smoothrecorder.com


Work · 14d ago · readrare.com
Source: Product Hunt launch ↗