
Visualising Data
The essential collection of visualisation resources
Visualising Data launched on June 25, 2017 with 7 votes, #1,104 of 3,107 launches that month. The site was still online in September 2026, 9 years on.
What it does
DATA VISUALISATION RESOURCES This is a collection of some of the many data visualisation (and related) tools, applications, toolkits, libraries, platforms, and packages. Organised loosely around several categories, based on the best-fit descriptive characteristic or primary purpose, this collection has been curated since the early 2010s to provide readers with as current and as comprehensive [&hel
Does a similar job
all alternatives →

 The Data Visualisation Catalogue2016 · datavizcatalogue.com · ▲94
Reference tool for data visualisation
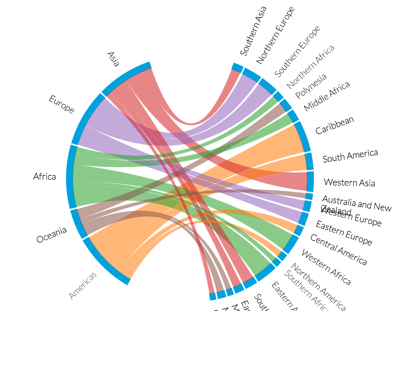
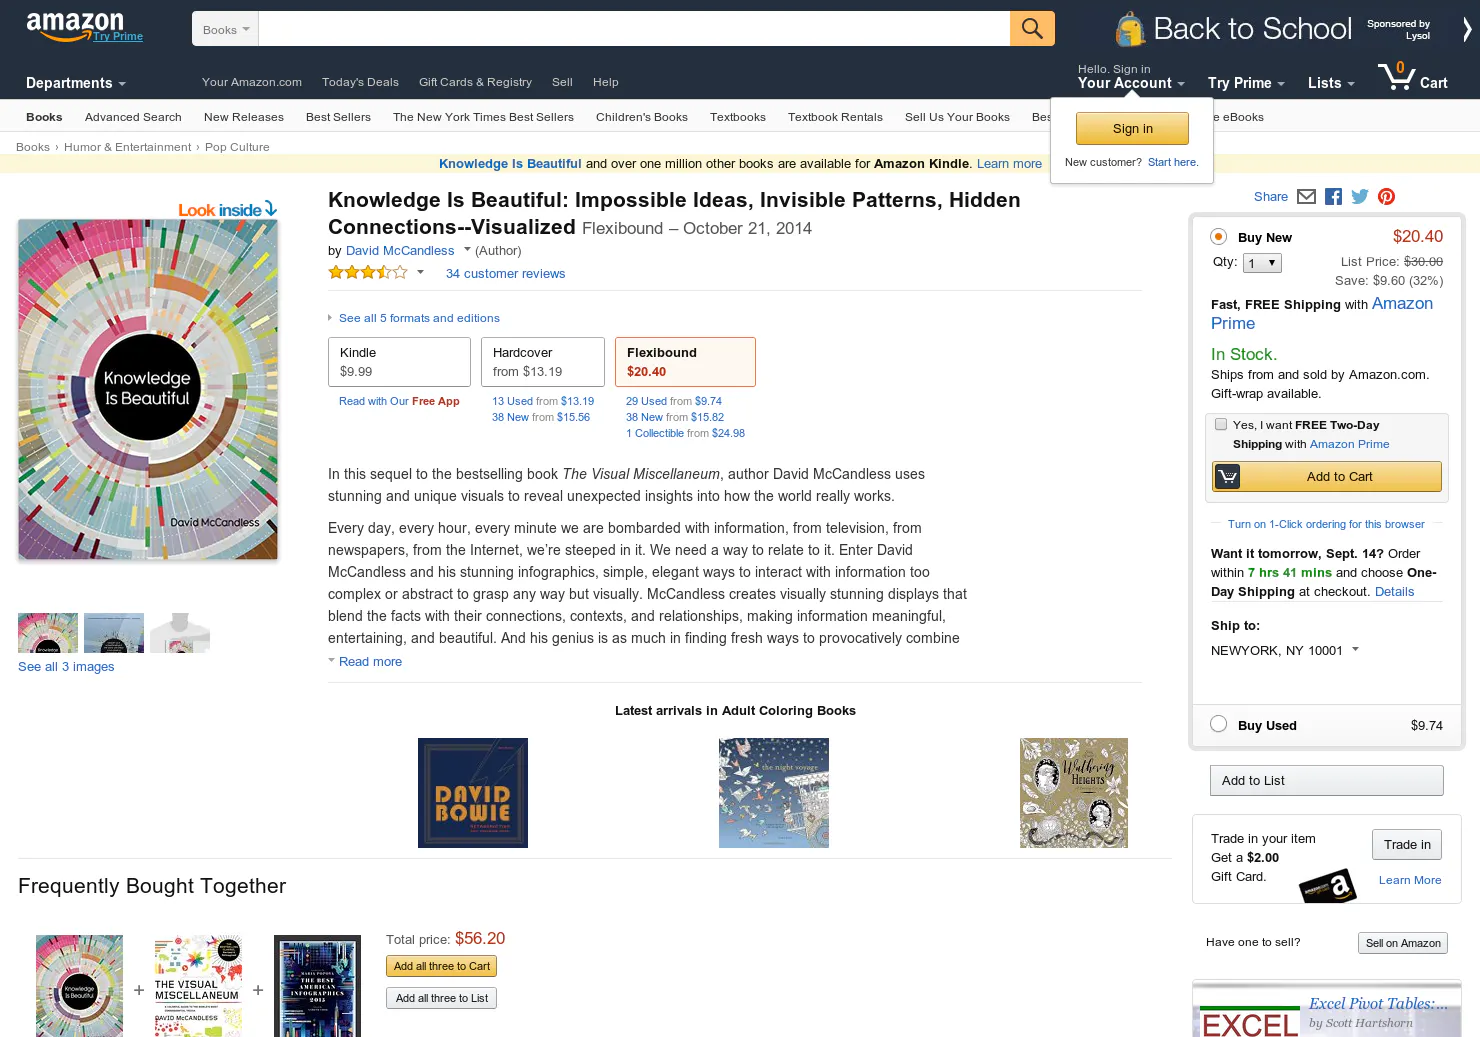 Knowledge is Beautiful2014 · amazon.com · ▲97
Taking infographics & data-visualisation next level (book)
 The Human Face of Big Data2015 · lightshow.lol · ▲71
Visualizing the extraordinary Big Data revolution
More growth this month
the category →
wallhop is a free paywall bypass. Paste any article link to read it without paywall popups, ads or clutter. No signup, no extension. A simple 12ft.io alternative.
Growth · 16d ago · wallhop.io

Source: Product Hunt launch ↗
Launched alongside, June 2017
the whole month →- GP
Work · 2017 · demandrush.com

Monica helps you remember the people you care about: what is happening in their life, important dates, previous conversations, and when to get back in touch. Private, open source, self-hostable.
Dev tools · 2017 · monicahq.com




The growth guide by DemandCurve.com and Julian Shapiro
Growth · 2017 · julian.com