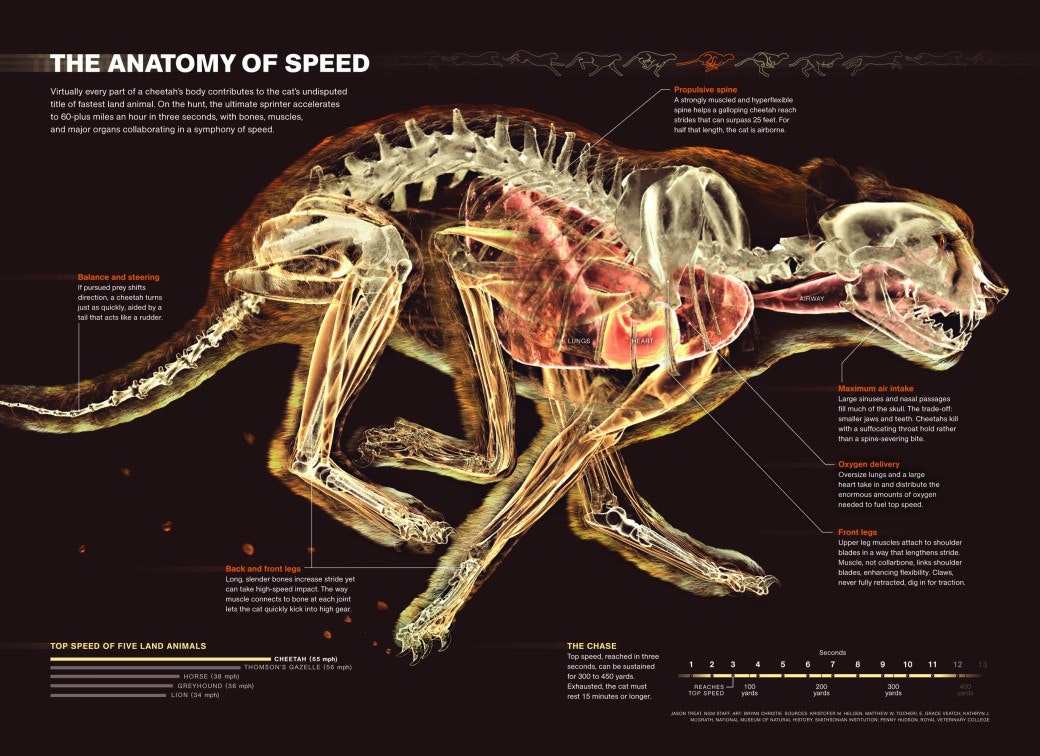
Visualoop
Dribbble for infographic & data visualization artists
Visualoop launched on July 21, 2015 with 171 votes, #147 of 4,208 launches that month and more than 95% of that year's launches.
Does a similar job
all alternatives →


More work this month
the category →
Endless lofi beats composed live in your browser, over pixel-art nights in Paris, Tokyo, New York, Hong Kong, Sydney, San Francisco and more. Free, no sign-up.
Work · 24d ago · loficities.com
 Smooth Recorder▲257
Mac screen recordings that look edited when you hit stop
Work · 18d ago · smoothrecorder.com


Work · 12d ago · readrare.com
Source: Product Hunt launch ↗
Launched alongside, July 2015
the whole month → Hotjar▲1,312
See how visitors are using your site and get visual feedback
Growth · 2015 · contentsquare.com
 Spot the Drowning Child▲1,215
Can you spot the drowning child in this crowded wave pool? To the untrained eye, drowning looks like swimming. The Instinctive Drowning Response is frequently missed, even by people nearby.
Life & fun · 2015 · spotthedrowningchild.com

Docker implemented in around 100 lines of bash. Contribute to p8952/bocker development by creating an account on GitHub.
Dev tools · 2015 · github.com


Guida completa ai siti scommesse americani 2026: scopri i migliori bookmaker USA, licenze, bonus, sport americani, metodi pagamento e consigli utili.
AI · 2015 · whoishiring.it