Dev tools · alternatives · 2026

24 alternatives to (1 day project) I crawled +50k subreddits and made an interactive graph
Graph of subreddits. Contribute to ghgr/reddit-graph development by creating an account on GitHub.
This project presents an interactive graph built from data crawled across over 50,000 subreddits. It allows users to visualize and explore relationships and connections within Reddit's community structure. The tool is… Below are 24 products that do a similar job, ranked by how close each is in meaning and then by launch-day votes. (1 day project) I crawled +50k subreddits and made an interactive graph launched in 2018; newer entries below may have overtaken it.
- 1AT
This visualization of related subreddits helps you find related subreddits
2019 · anvaka.github.io · its alternatives →
- 2

Accessible end-to-end deep dive of crawling, embedding, projecting, and semantic searching all of Hacker News for my Hackerverse project.
2024 · blog.wilsonl.in · its alternatives →
- 3
Visual map of the top 50,000 subreddits by similarity
2017 · ponderinghydrogen.pythonanywhere.com · its alternatives →
- 4

We built Valohai LLM for tracking and comparing LLM evaluation results. Whether your evals live in notebooks and spreadsheets, or you're using an observability tool that wasn't built for comparison, this gives you a purpose-built eval comparison dashboard. Run evals with a Python library (pip install valohai-llm), results stream in, and you can compare up to 6 configurations side by side. Group by any dimension (model, category, difficulty) to see where each model excels. It doesn't do tracing or production observability, for now just eval tracking and comparison. What's cool is that you can…
2020 · valohai.com · its alternatives →
- 5MA
2017 · lmcinnes.github.io · its alternatives →
- 6
 GitNews Web▲265
Trending repositories from GitHub, HackerNews & Reddit
2019 · git.news · its alternatives →
- 7
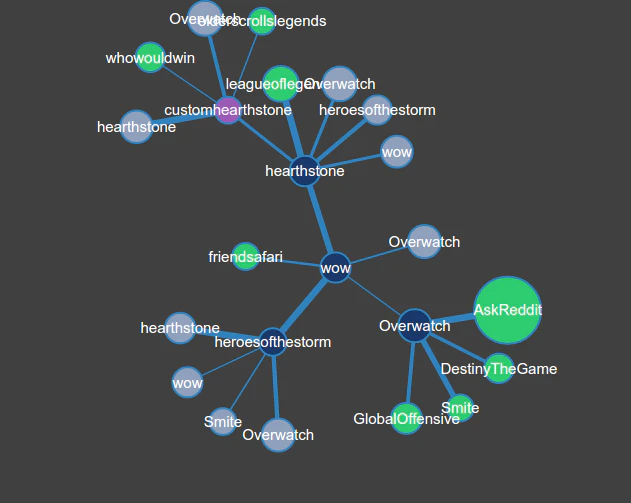
- 8RG
2017 · redditgrid.com · its alternatives →
- 9
 GitNews▲296
Trending repositories from GitHub, HackerNews & Reddit
2018 · gitnews.learn.uno · its alternatives →
- 10
 GitRanks▲127
Hi HN, I built GitRanks because I’ve always wanted a clear, fun way to see how my open-source work compares - both globally and right here at home. The app pulls in GitHub data to give every developer an at-a-glance “scorecard”, then rolls those into live leaderboards so you can: - Track rankings by stars, contributions and followers - Filter worldwide vs. your own country - Refresh daily - no waiting weeks to see your progress - Discover rising devs you’ve never heard of and follow their work Tech Stack: - Back: MongoDB | NestJS | BullMQ | GraphQL - Front: Next.js | Tailwind | Shadcn Data:…
2025 · gitranks.com · its alternatives →
- 11

2016 · oracleofnj.github.io · its alternatives →
- 12AT
Hi HN, I spent a few weeks looking at the top HN posts of all time. This included exploration, clustering, creating visualizations, and zooming in on what (to me personally) seems like some of the best discussions on here. Three things in this post: 1- The interesting groups of HN posts 2- The interactive visualizations that you can explore in your browser 3- The data from this exploration -- this includes CSV of the titles as well as the text embeddings of 3,000 Ask HN articles. Blog post about this whole process here: [1] ============ 1- The interesting groups of HN posts From the…
2022 · its alternatives →
- 13

Hi HN! Excited to show another gamification way of visualize github contribution graph!
Jan 2026 · github.com · its alternatives →
- 14

- 15

Visualize podcast audience connections in 3D.
2021 · rephonic.com · its alternatives →
- 16

2016 · github.com · its alternatives →
- 17

View and print a 3D model of your GitHub contribution graph
2021 · skyline.github.com · its alternatives →
- 18
- 19IB
It took me six months to analyze 562 subreddits. I systematically parsed titles, post bodies, and user interactions to identify statistically significant patterns and evaluate if it was possible to create a model that could predict the likelihood of a post going viral based on specific features. The key findings were unexpected: while the title of a post has a direct correlation with engagement, there is another highly influential factor I initially overlooked, timing. The optimal time to post on Reddit, in terms of engagement, can significantly vary based on geographic distribution. The…
2025 · its alternatives →
- 20

- 21

Visualize GitHub's most popular repos. http://www.donnemartin.com/viz - donnemartin/viz
2016 · github.com · its alternatives →
- 22

Generate a free visual sitemap from any URL. Crawl up to 25,000 pages* and quickly map your website’s structure with Rarchy.
2021 · rarchy.com · its alternatives →
- 23

This website shows a map of reddit. Each dot is a subreddit. Two dots within the same cluster are usually close to each other if multiple users frequently leave comments on both subreddits
2021 · anvaka.github.io · its alternatives →
- 24

Also compare
- A tool to find related subreddits alternatives
- Exploring HN by mapping and analyzing 40M posts and comments for fun alternatives
- Subreddit Recommender alternatives
- Subreddit Finder - Trained on 4M Reddit Posts from 4K Subreddits alternatives
- Mapping and Analysing Subreddits alternatives
- GitNews Web alternatives
Ranked by how close each launch is in meaning, then by votes. Prices were read from each product’s own site when checked and can change. Refine with your own description →