Life & fun · alternatives · 2026

24 alternatives to A web service which renders SVG plots from Prometheus data
Below are 24 products that do a similar job, ranked by how close each is in meaning and then by launch-day votes. A web service which renders SVG plots from Prometheus data launched in 2020; newer entries below may have overtaken it.
- 1

Customize, scalable backgrounds and patterns for free
2018 · svgbackgrounds.com · its alternatives →
- 2LS
2016 · plotti.co · its alternatives →
- 3

- 4

- 5

Just wanted to share with HN a simple/minimal open source Python library that generates SVG files visualizing two dimensional data and distributions, in case others find it useful or interesting. I wrote it as a fun project, mostly because I found that the standard libraries in Python generated unnecessarily large SVG files. One nice property is that I can configure the visuals through CSS, which allows me to support dark/light mode browser settings. The graphs are specified as JSON files (the repository includes a few examples). It supports scatterplots, line plots, histograms,…
Mar 2026 · github.com · its alternatives →
- 6ES
2014 · chartspree.com · its alternatives →
- 7AT
2021 · svija.love · its alternatives →
- 8

Harness power & possibilities of performance-efficient SVG.
2016 · abookapart.com · its alternatives →
- 9
- 10

API for beautiful interactive graphics from time-series data
2014 · metricsgraphicsjs.org · its alternatives →
- 11

- 12RW
Hi HN, I'm Holger, a developer who worked in the lighting industry. I built this to scratch my own itch and put it on crates.io and PyPI where nothing like it existed. The old file formats (EULUMDAT from 1990, IES from 1991) still work fine for basic photometry. But the industry is moving toward spectral data – full wavelength distributions instead of just lumen values. The new standards (TM-33, ATLA-S001) are barely supported by existing tools. So this handles both: legacy formats for compatibility, spectral data for anyone who wants to work with the new standards. Stack: Rust core, then…
Dec 2025 · eulumdat.icu · its alternatives →
- 13
- 14ST
2015 · mattdesl.github.io · its alternatives →
- 15

The future of online data visualization tools
2016 · policyviz.com · its alternatives →
- 16
 Variance▲91
Build powerful data visualizations for the web.
2014 · variancecharts.com · its alternatives →
- 17

- 18

Generate parliament charts as virtual-dom SVG. Contribute to juliuste/parliament-svg development by creating an account on GitHub.
2017 · github.com · its alternatives →
- 19

This has been an experiment to see if I could create everything using scripts and AI. If AI couldn't do it I'd get it to create the code such as API calls and so on. This websvg.com site was completely created using these AI tools. Including the DNS being applied, the Cloudflare Pages were automatically set up and the the web site was a Svelte 5 application generated by v0.dev and Cursor. Every image was generated in Midjourney and converted to SVG. I have now taken all of these scripts and can create a similar landing or directory site in less than a minute, provided I have the data. Anyway…
2025 · websvg.com · its alternatives →
- 20
 Charts▲8
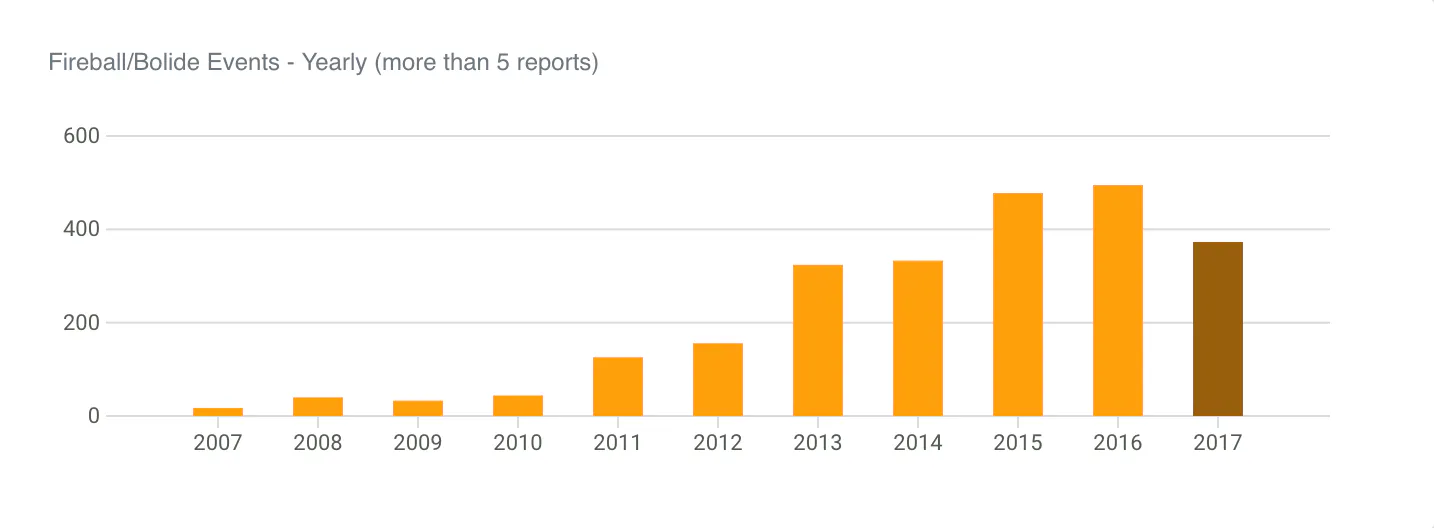
A simple and responsive SVG chart lib with zero dependencies
2017 · frappe.github.io · its alternatives →
- 21WM
2022 · go.instill.tech · its alternatives →
- 22

Free svg background generator for your websites, blogs and app.
2020 · bgjar.com · its alternatives →
- 23
 SVG Weave▲14
Hey HN, I'm a solo dev and I kept wasting hours hand-writing CSS @keyframes to animate SVGs. Write a keyframe, preview, tweak the timing, preview again, repeat. For anything beyond a simple fade it turns into dozens of rules across multiple elements. I wanted something where I could just describe the motion and get working animations back. SVG Weave is a visual node graph editor for this. You place nodes on a canvas (SVG input, prompt, render) and connect them with wires. Type what you want the animation to do, hit render, and the AI streams CSS @keyframes back in real time. You see the SVG…
Feb 2026 · svgweave.com · its alternatives →
- 24SB
2025 · blog.viraptor.info · its alternatives →
Also compare
Ranked by how close each launch is in meaning, then by votes. Prices were read from each product’s own site when checked and can change. Refine with your own description →