Dev tools · alternatives · 2026

24 alternatives to Data-Cent – Interactive CSV Visualization and Analysis in Your Browser
I built Data-Cent because I often need to explore CSVs quickly without firing up pandas or writing custom code. It’s a Streamlit-based web app where you can: • Upload CSV files (no setup) • Auto-filter and explore the data • Create interactive charts (line, bar, scatter, etc.) • Run quick stats (mean, median, std) • Download a PDF/HTML report of your analysis Live demo: https://data-cent.streamlit.app/ Source: https://github.com/data-centt/Data-Analytics Would love feedback on performance and UI/UX — especially from folks who explore data often or…
Below are 24 products that do a similar job, ranked by how close each is in meaning and then by launch-day votes.
- 1

- 2VO
Hello HN. I've always found writing data visualisation scripts boring and repetitive in data science workflows earlier in my career, so I built this tool to automate it. The available methods are based on my experience in econometrics where histograms and scatterplots were the starting points to check data distributions. The link is to the documentation and the app is freely available at https://visprex.com, and if you're curious about the implementation it's open source at https://github.com/visprex/visprex. I'd appreciate any comments and feedback!
2024 · docs.visprex.com · its alternatives →
- 3
 DataSquirrel.ai▲268
Fastest way: csv/xls to dashboard report, no ChatGPT upload
2023 · datasquirrel.ai · its alternatives →
- 4
 BStreams▲62
Interactive, easy, responsive data visualization & analysis
2021 · bstreams.io · its alternatives →
- 5

Free chart maker & visual exploration for spreadsheet data
2020 · its alternatives →
- 6
 Embedful ▲150
Easy data visualizations. Embed and share anywhere.
Mar 2026 · embedful.io · its alternatives →
- 7
- 8

Streamlit — A faster way to build and share data apps. - streamlit/streamlit
2019 · github.com · its alternatives →
- 9
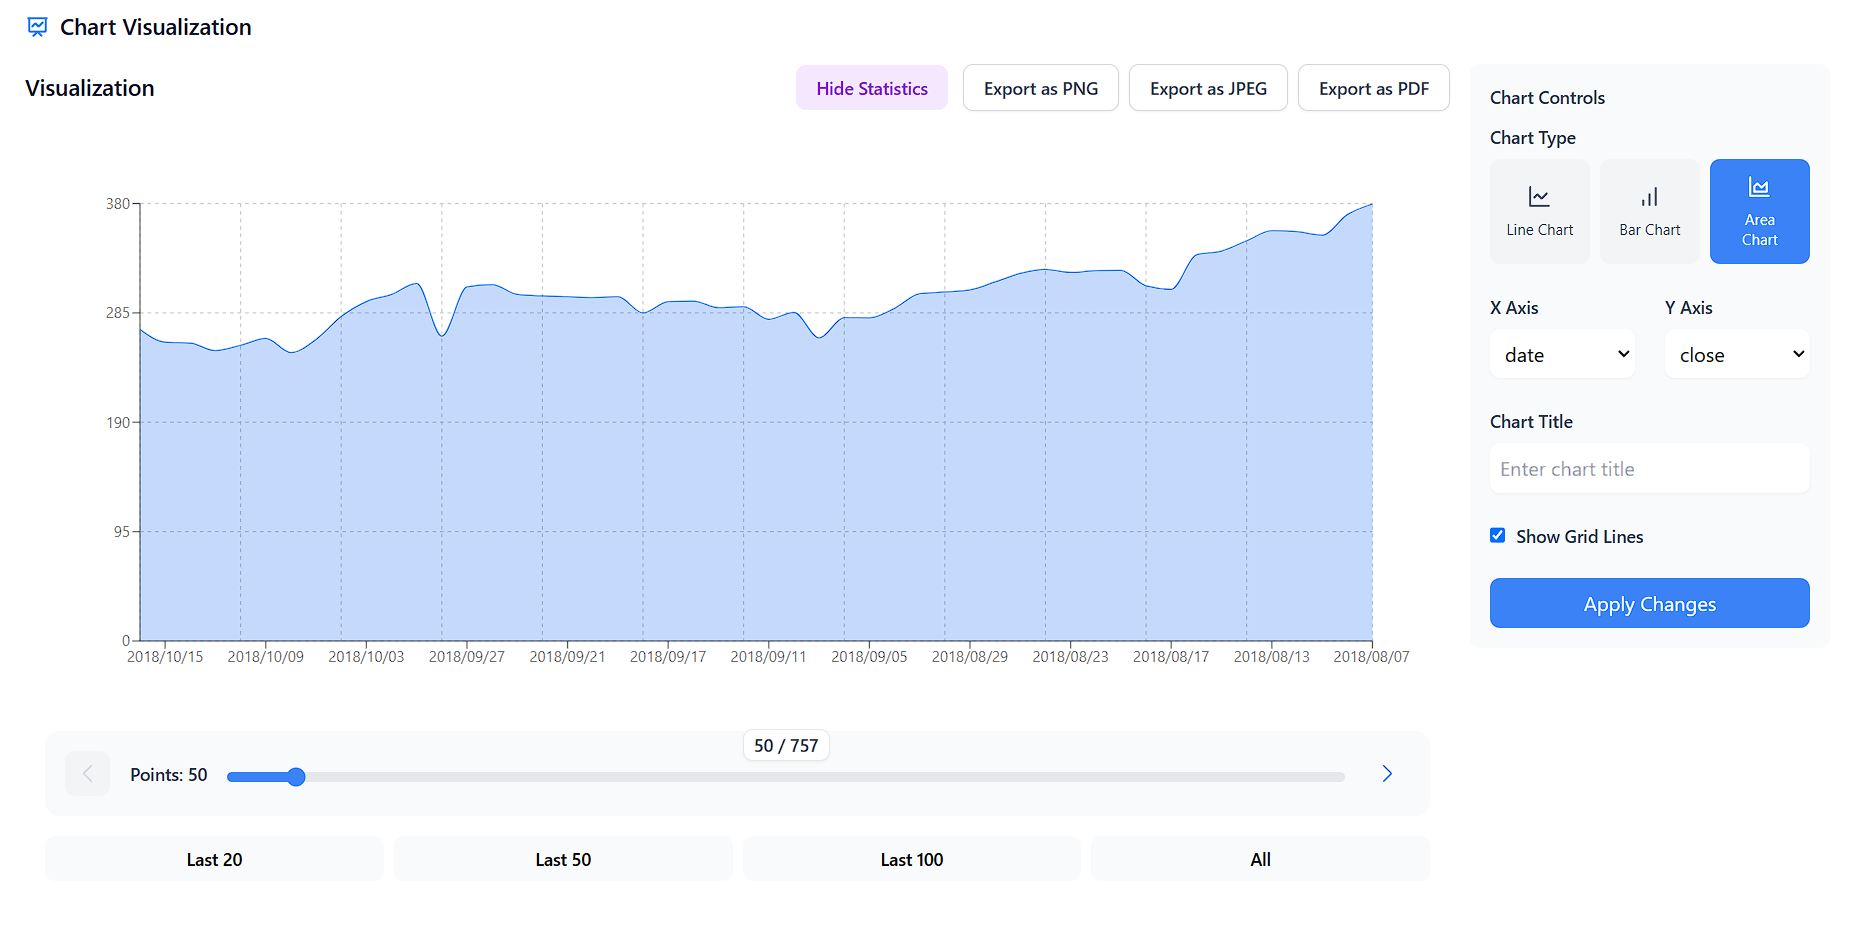
CSV Visualizer: Turn raw data into stunning visuals fast! 📊
2024 · csv-data-visualizer.netlify.app · its alternatives →
- 10

I built CSV GB+ by Data.olllo, a local data tool that lets you open, clean, and export gigabyte-sized CSVs (even billions of rows) without writing code. Most spreadsheet apps choke on big files. Coding in pandas or Polars works—but not everyone wants to write scripts just to filter or merge CSVs. CSV GB+ gives you a fast, point-and-click interface built on dual backends (memory-optimized or disk-backed) so you can process huge datasets offline. Key Features: Handles massive CSVs with ease — merge, split, dedup, filter, batch export Smart engine switch: disk-based "V Core" or RAM-based "P…
2025 · apps.microsoft.com · its alternatives →
- 11
Data Analysis Made Simple, Fast, and Code-Free.
2025 · share.streamlit.io · its alternatives →
- 12

Hi HN, I started building Datastripes as part of my thesis, trying to answer a simple question: How can non-technical teams turn raw data into insights without relying on developers or BI tools? What began as research has now grown into a working product, built by a small team, focused on solving that exact problem. Datastripes is a no-code platform for creating dashboards and data visualizations in minutes: no SQL, no setup, no friction. What it does: Connects to CSVs, Google Sheets, or APIs Drag-and-drop dashboard builder Shareable via public links or embed Fully browser-based We’re…
Jan 2026 · datastripes.com · its alternatives →
- 13
 ChartStud▲106
Turn messy data into clear decisions in minutes
Feb 2026 · chartstud.com · its alternatives →
- 14
 Marple▲86
Hi HN! I’m Nero from Marple, and we build time series tooling for Aerospace & Automotive. In 2020, we launched our first product: a sort of Grafana on steroids designed for high performance analysis. After integrating with a lot of different TS databases, we kept running into their design limits when trying to deliver the best performance & UX to our users. That’s why we are launching Marple DB today (https://www.marpledata.com/marple-db). Marple DB transforms measurements files (CSV, MAT, HDF5, TDMS, …) into a queryable lakehouse. We designed for extreme ingestion…
2022 · marpledata.com · its alternatives →
- 15

Visualize data from your boards, CSV, and other apps
2019 · its alternatives →
- 16
- 17
 CSV Plot▲6
Turn Your CSV Data into Insights in Seconds.
Jan 2026 · csvplot.netlify.app · its alternatives →
- 18
 Vizician▲77
Drag & drop your data for instant visual data exploration
2022 · vizician.com · its alternatives →
- 19GR
I built this as part of my quest to properly learn data visualization. The code is the easy part! Some lessons learned: - personal verification of the the general truth that pie charts are tough! and the returns are not great for the effort due to people's difficulties perceiving angles - may not use "vanilla" d3 with no React. was difficult to adapt for mobile - the GitHub API provides fairly standardized responses so building dynamic charts wasn't too bad. But when working with streaming data (say Kafka) I can see this getting interesting... schema registry should help but creating a view…
2024 · see-my-repo.netlify.app · its alternatives →
- 20

Visualize your CSV, Excel, and JSON data
2025 · aaaenos.com · its alternatives →
- 21

- 22SB
2017 · martin.varela.fi · its alternatives →
- 23
 CSVSense▲7
Online CSV Editor, CSV Viewer and Data Visualisation Tool
2023 · csvsense.com · its alternatives →
- 24

Hello HN, Wish you a very Happy New Year. StatPecker is our baby project. A cute little infographics generation tool for anybody seeking insights. We recently dropped a new feature, to help user upload CSV upto 50mb or in other words data with ~1 million rows. We wanted to make sure user data doesn’t get leaked, so we developed a mechanism where the CSV is analysed on user’s device. We only use our AI APIs to generate SQL queries on the fly and query the DB on user’s machine, along with the final response for aggregated data. The result turns out to be quite fast. Would love you to try it out.
Nov 2025 · app.statpecker.com · its alternatives →
Also compare
Ranked by how close each launch is in meaning, then by votes. Prices were read from each product’s own site when checked and can change. Refine with your own description →