
CSV Plot
Turn Your CSV Data into Insights in Seconds.
CSV Plot launched on January 6, 2026 with 6 votes, #2,272 of 14,585 launches that month and more than 75% of that year's launches.
What it does
Instantly transform your CSV data into insightful line charts with our lightning-fast visualization tool! Simply drag and drop your CSV file, select the columns you want to explore, and watch as tens of thousands of data points come to life seamlessly. Your data stays completely secure, processed locally on your device – no uploads required. Ideal for quick data exploration and trend analysis.
Turn your CSV into beautiful interactive graphs in seconds. No data uploads, no signup, and 100% private.
Does a similar job
all alternatives →
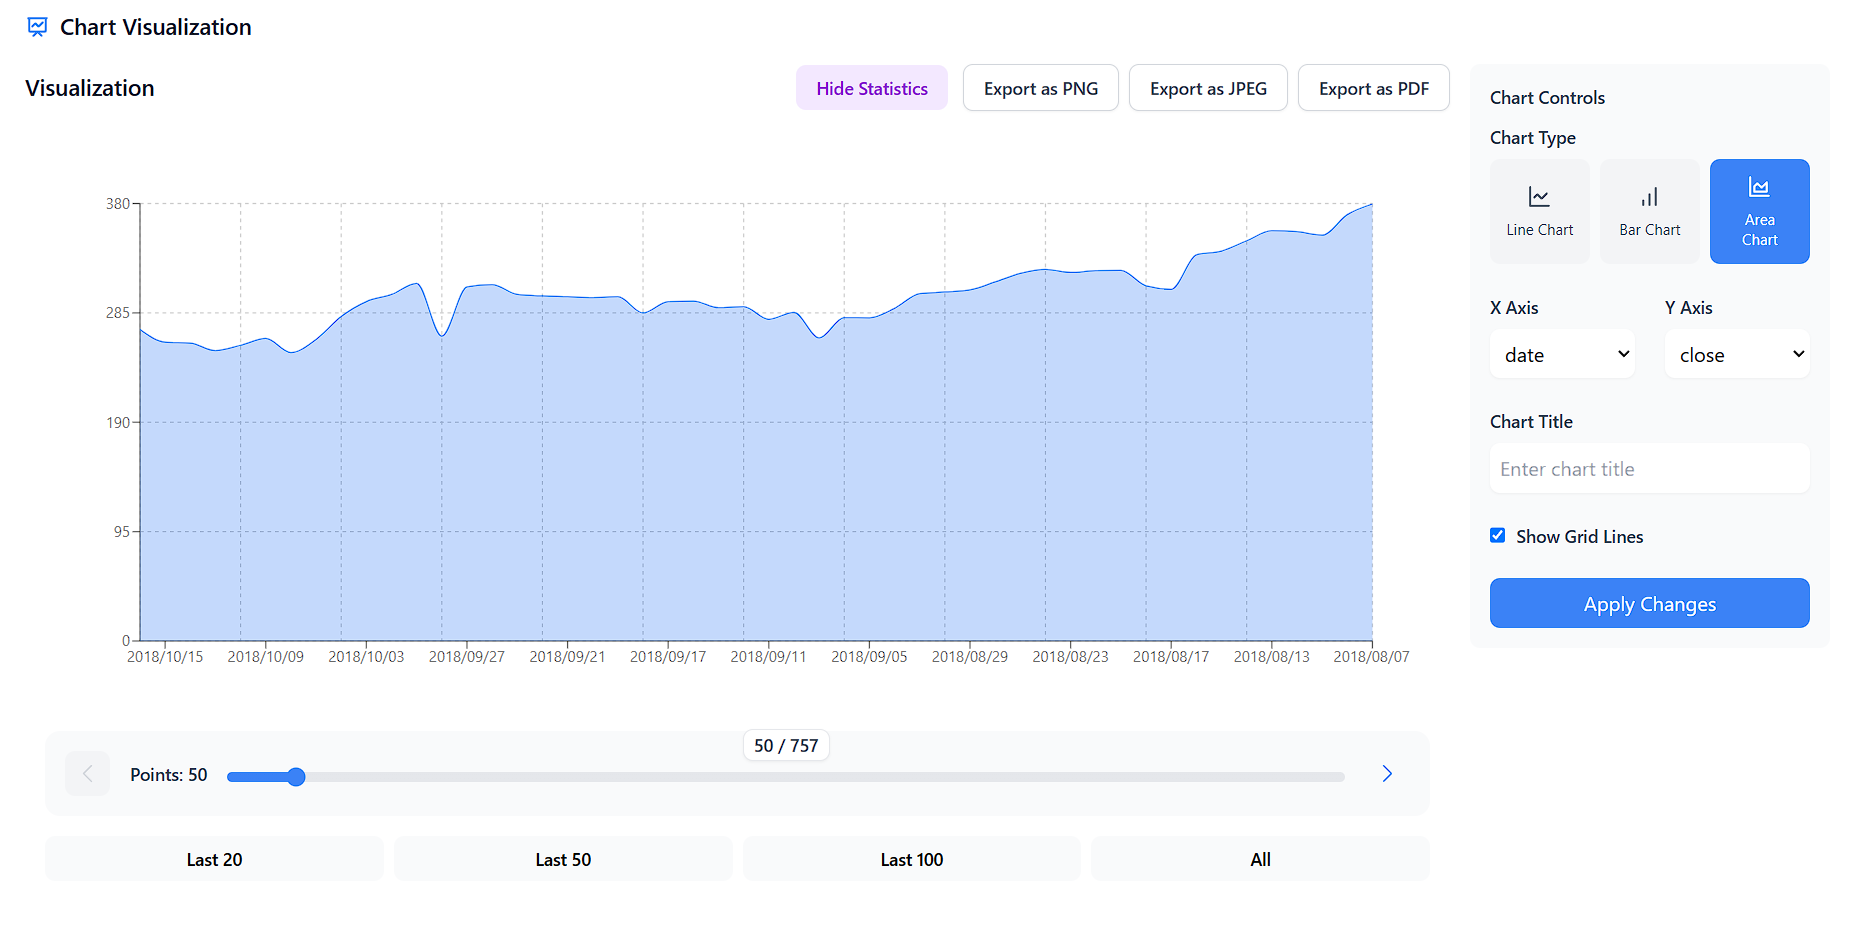 CSV Data Visualizer2024 · csv-data-visualizer.netlify.app · ▲8
CSV Visualizer: Turn raw data into stunning visuals fast! 📊
 Plotiq – Turn CSV files into graphs instantlyMar 2026 · plotiq-web.web.app · ▲7
I built a simple tool that converts CSV files into graphs instantly. The idea came from seeing how much time people spend opening spreadsheets or writing code just to visualize data. I wanted something where you can just upload a CSV and get charts immediately. It currently supports quick line and basic chart visualizations from CSV datasets. I’d really appreciate feedback from people who work with data or frequently analyze CSV files.
- DTDropbase – Turn your CSV files into live databases in seconds2020 · dropbase.castodia.com · ▲26


More work this month
the category →
Endless lofi beats composed live in your browser, over pixel-art nights in Paris, Tokyo, New York, Hong Kong, Sydney, San Francisco and more. Free, no sign-up.
Work · 24d ago · loficities.com
 Smooth Recorder▲257
Mac screen recordings that look edited when you hit stop
Work · 18d ago · smoothrecorder.com


Work · 12d ago · readrare.com
Source: Product Hunt launch ↗
Launched alongside, January 2026
the whole month →- IN
Hey HN! I wanted to share something I built over the last few weeks: isometric.nyc is a massive isometric pixel art map of NYC, built with nano banana and coding agents. I didn't write a single line of code. Of course no-code doesn't mean no-engineering. This project took a lot more manual labor than I'd hoped! I wrote a deep dive on the workflow and some thoughts about the future of AI coding and creativity: http://cannoneyed.com/projects/isometric-nyc
AI · Jan 2026 · cannoneyed.com


Automatic AI-powered code reviews the moment you open a PR
Dev tools · Jan 2026 · kilo.ai
