Work · alternatives · 2026

24 alternatives to DataVisualizer
DataVisualizer is a Web Solution to visualize CSV/JSON data
Below are 24 products that do a similar job, ranked by how close each is in meaning and then by launch-day votes. Prices are shown for the 1 we have checked on their own sites, 1 of them free or with a free tier. DataVisualizer launched in 2019; newer entries below may have overtaken it.
- 1
- 2
 dataviz.tools▲409
Curated collection of the 400 best data visualization tools
2017 · dataviz.tools · its alternatives →
- 3

- 4

Create pro-level graphs that drive actions
2024 · graphy.app · its alternatives →
- 5TL
2018 · charts.com · its alternatives →
- 6

An extension for VS Code that visualizes data during debugging. - vscode-debug-visualizer/extension at master · hediet/vscode-debug-visualizer
2020 · github.com · its alternatives →
- 7

After two years of improvement, I think it's time to share it with you all. Here’s a quick overview: - Common features include validation, formatting, minification, and more. - Visualize JSON in a graph or table view. - Structured comparison with fallback to text comparison. - Navigate though JSON using JSON pointer. - Supports jq. Would love to hear the community's questions, thoughts and comments!
2024 · github.com · its alternatives →
- 8
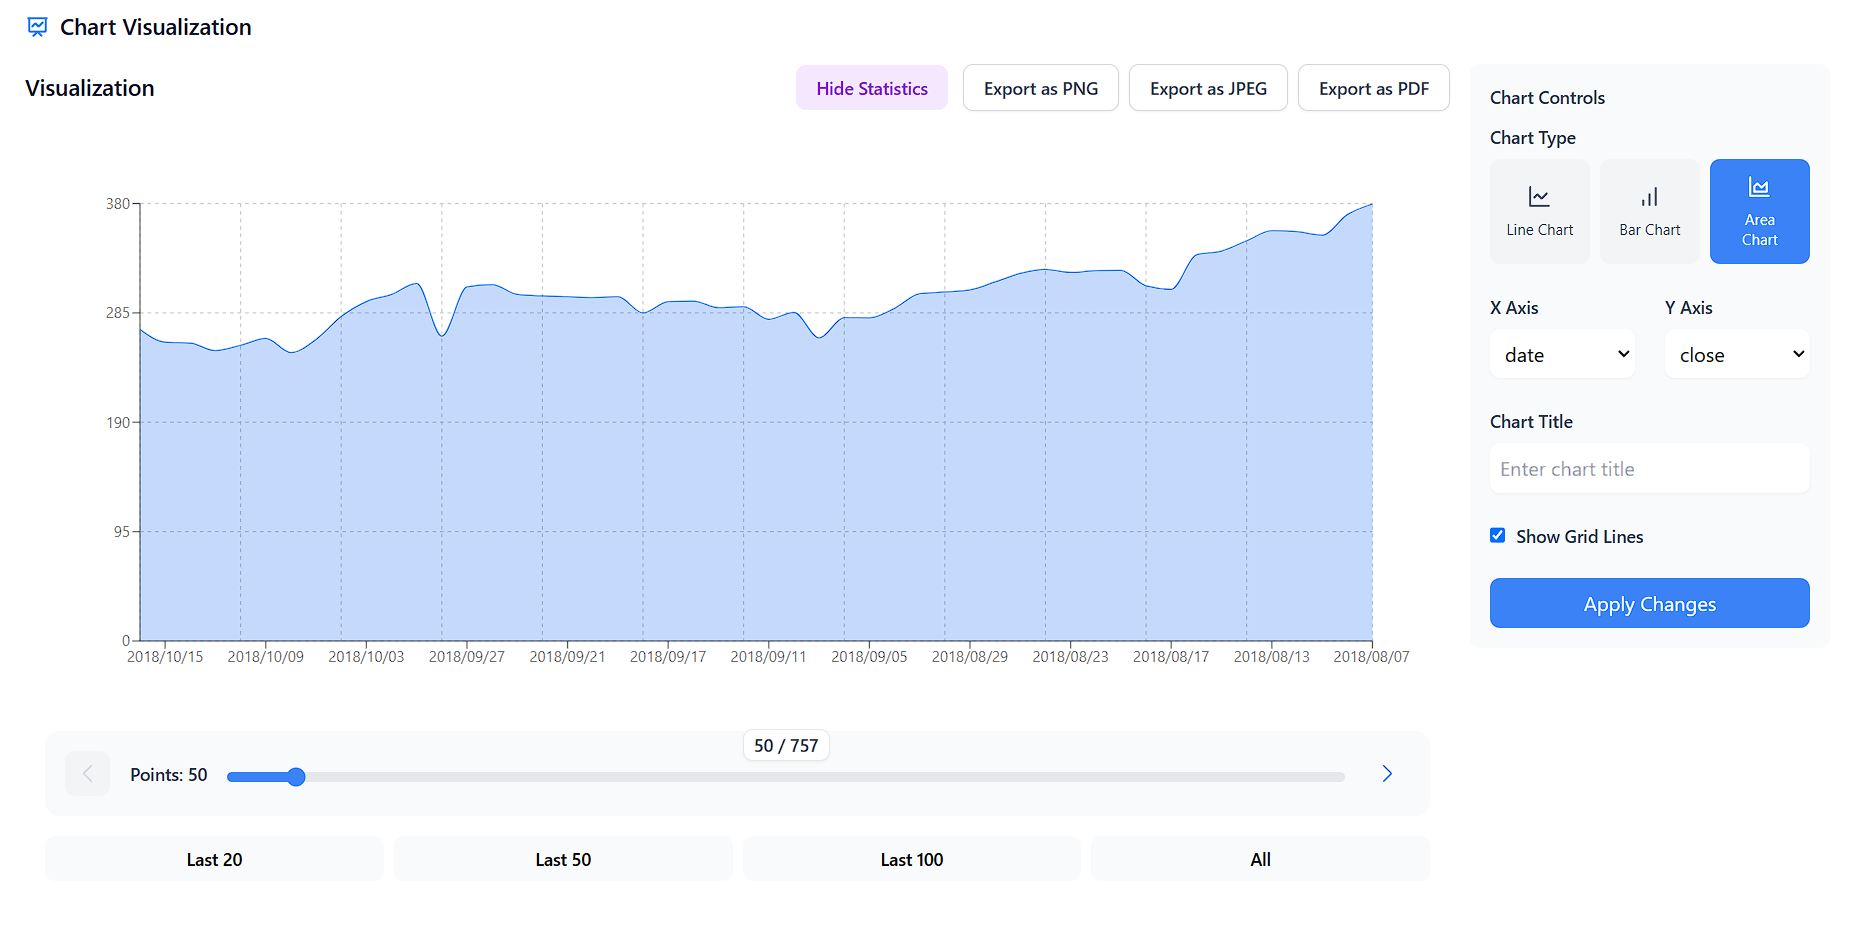
CSV Visualizer: Turn raw data into stunning visuals fast! 📊
2024 · csv-data-visualizer.netlify.app · its alternatives →
- 9

Engineer - Hacker - Technology Addict
2014 · jackhanford.com · its alternatives →
- 10

Web app that visualizes data structures in action
2025 · datastructuresvisualization.netlify.app · its alternatives →
- 11

Charts and infographics constructor in Figma
2021 · store.123d.one · its alternatives →
- 12

Write down your algorithm to be visualized
2016 · jasonpark.me · its alternatives →
- 13VO
Hello HN. I've always found writing data visualisation scripts boring and repetitive in data science workflows earlier in my career, so I built this tool to automate it. The available methods are based on my experience in econometrics where histograms and scatterplots were the starting points to check data distributions. The link is to the documentation and the app is freely available at https://visprex.com, and if you're curious about the implementation it's open source at https://github.com/visprex/visprex. I'd appreciate any comments and feedback!
2024 · docs.visprex.com · its alternatives →
- 14

Creating data visualizations with AI nowadays often means chat, chat and more chats...and writing long prompts can be annoying while they are also not the most effective way to describe your visualization designs. Data Formulator blends UI interaction with natural language so that you can create visualizations with AI much more effectively! You can: * create rich visualizations beyond initial datasets, where AI helps transforming and visualizing data along the way * iterate your designs and dive deeper using data threads, a new way to manage your conversation with AI. Here is a demo video:…
2024 · github.com · its alternatives →
- 15

Vue JSON inspector with Chrome-like theme. Contribute to soc221b/object-visualizer development by creating an account on GitHub.
2020 · github.com · its alternatives →
- 16

Visualize data from your boards, CSV, and other apps
2019 · its alternatives →
- 17

- 18
 Embedful ▲150
Easy data visualizations. Embed and share anywhere.
Mar 2026 · embedful.io · its alternatives →
- 19

What's in your data? Extract schema, statistics and entities from datasets - capitalone/DataProfiler
2021 · github.com · its alternatives →
- 20

- 21

Reference tool for data visualisation
2016 · datavizcatalogue.com · its alternatives →
- 22

Visualize your CSV, Excel, and JSON data
2025 · aaaenos.com · its alternatives →
- 23DV
2017 · dvblogger.com · its alternatives →
- 24

Also compare
Ranked by how close each launch is in meaning, then by votes. Prices were read from each product’s own site when checked and can change. Refine with your own description →