Life & fun · alternatives · 2026
24 alternatives to Data visualization news
Data Visualization News is a life and fun website launched in 2017 that covers news and stories related to data visualization. It serves people interested in how data is presented visually across various media and… Below are 24 products that do a similar job, ranked by how close each is in meaning and then by launch-day votes. Prices are shown for the 1 we have checked on their own sites, 1 of them free or with a free tier. Data visualization news launched in 2017; newer entries below may have overtaken it.
- 1
website collecting news from the field of data visualization
2017 · its alternatives →
- 2

- 3

Create pro-level graphs that drive actions
2024 · graphy.app · its alternatives →
- 4
 dataviz.tools▲409
Curated collection of the 400 best data visualization tools
2017 · dataviz.tools · its alternatives →
- 5AN
2019 · newsphere.org · its alternatives →
- 6TL
2018 · charts.com · its alternatives →
- 7

Charts and infographics constructor in Figma
2021 · store.123d.one · its alternatives →
- 8
- 9
- 10

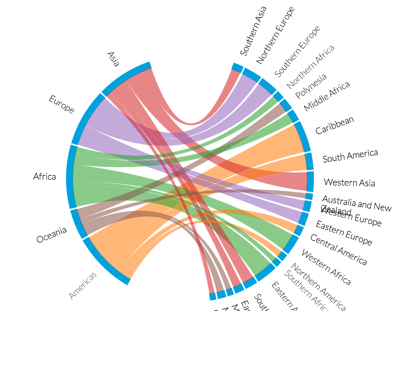
Creating data visualizations with AI nowadays often means chat, chat and more chats...and writing long prompts can be annoying while they are also not the most effective way to describe your visualization designs. Data Formulator blends UI interaction with natural language so that you can create visualizations with AI much more effectively! You can: * create rich visualizations beyond initial datasets, where AI helps transforming and visualizing data along the way * iterate your designs and dive deeper using data threads, a new way to manage your conversation with AI. Here is a demo video:…
2024 · github.com · its alternatives →
- 11

Web site created using create-react-app
2020 · showcase.metamate.io · its alternatives →
- 12

Catalog of all chart types and tools to build them
2017 · visualizationuniverse.com · its alternatives →
- 13

- 14
 dataxreports.com▲118
Browse our ready-to-use Google Data Studio templates
2024 · dataxreports.com · its alternatives →
- 15

Reference tool for data visualisation
2016 · datavizcatalogue.com · its alternatives →
- 16GA
Hi everyone! Graphs is the intersection of data visualization and the daily web puzzle genre (Wordle, NYT Mini Crossword, Connections, etc.). Every day, you are given a nameless graph and 5 options to select the right dataset it is representing. Upon winning, you can access the underlying dataset and other info + maintain a streak and stats. It's super simple - check out today's chart and you should be able to get the gist quickly. My email + twitter account (@graphsgame) is on the page, would love a feedback or a follow. Don't hesitate to reach out!
2024 · graphs.world · its alternatives →
- 17

Ideas, issues, knowledge, data — visualized!
2015 · informationisbeautiful.net · its alternatives →
- 18

Create beautiful emails, automate campaigns, and track performance. Try it now and see how our tools can drive your business.
2015 · tinyletter.com · its alternatives →
- 19

A web publication showcasing empirical research and data
2016 · ourworldindata.org · its alternatives →
- 20

Engineer - Hacker - Technology Addict
2014 · jackhanford.com · its alternatives →
- 21

- 22
 Vizpresso▲86
A visual way to consume interesting facts and news 🔍
2019 · vizpresso.com · its alternatives →
- 23

Research and data to make progress against the world’s largest problems.
2015 · ourworldindata.org · its alternatives →
- 24
Also compare
Ranked by how close each launch is in meaning, then by votes. Prices were read from each product’s own site when checked and can change. Refine with your own description →