Life & fun · alternatives · 2026

24 alternatives to Data visualizations of the world – Ourworldindata.org
Research and data to make progress against the world’s largest problems.
Below are 24 products that do a similar job, ranked by how close each is in meaning and then by launch-day votes. Data visualizations of the world – Ourworldindata.org launched in 2015; newer entries below may have overtaken it.
- 1

- 2DV
2017 · dvblogger.com · its alternatives →
- 3

A web publication showcasing empirical research and data
2016 · ourworldindata.org · its alternatives →
- 4

Catalog of all chart types and tools to build them
2017 · visualizationuniverse.com · its alternatives →
- 5

Charts and infographics constructor in Figma
2021 · store.123d.one · its alternatives →
- 6

Create pro-level graphs that drive actions
2024 · graphy.app · its alternatives →
- 7
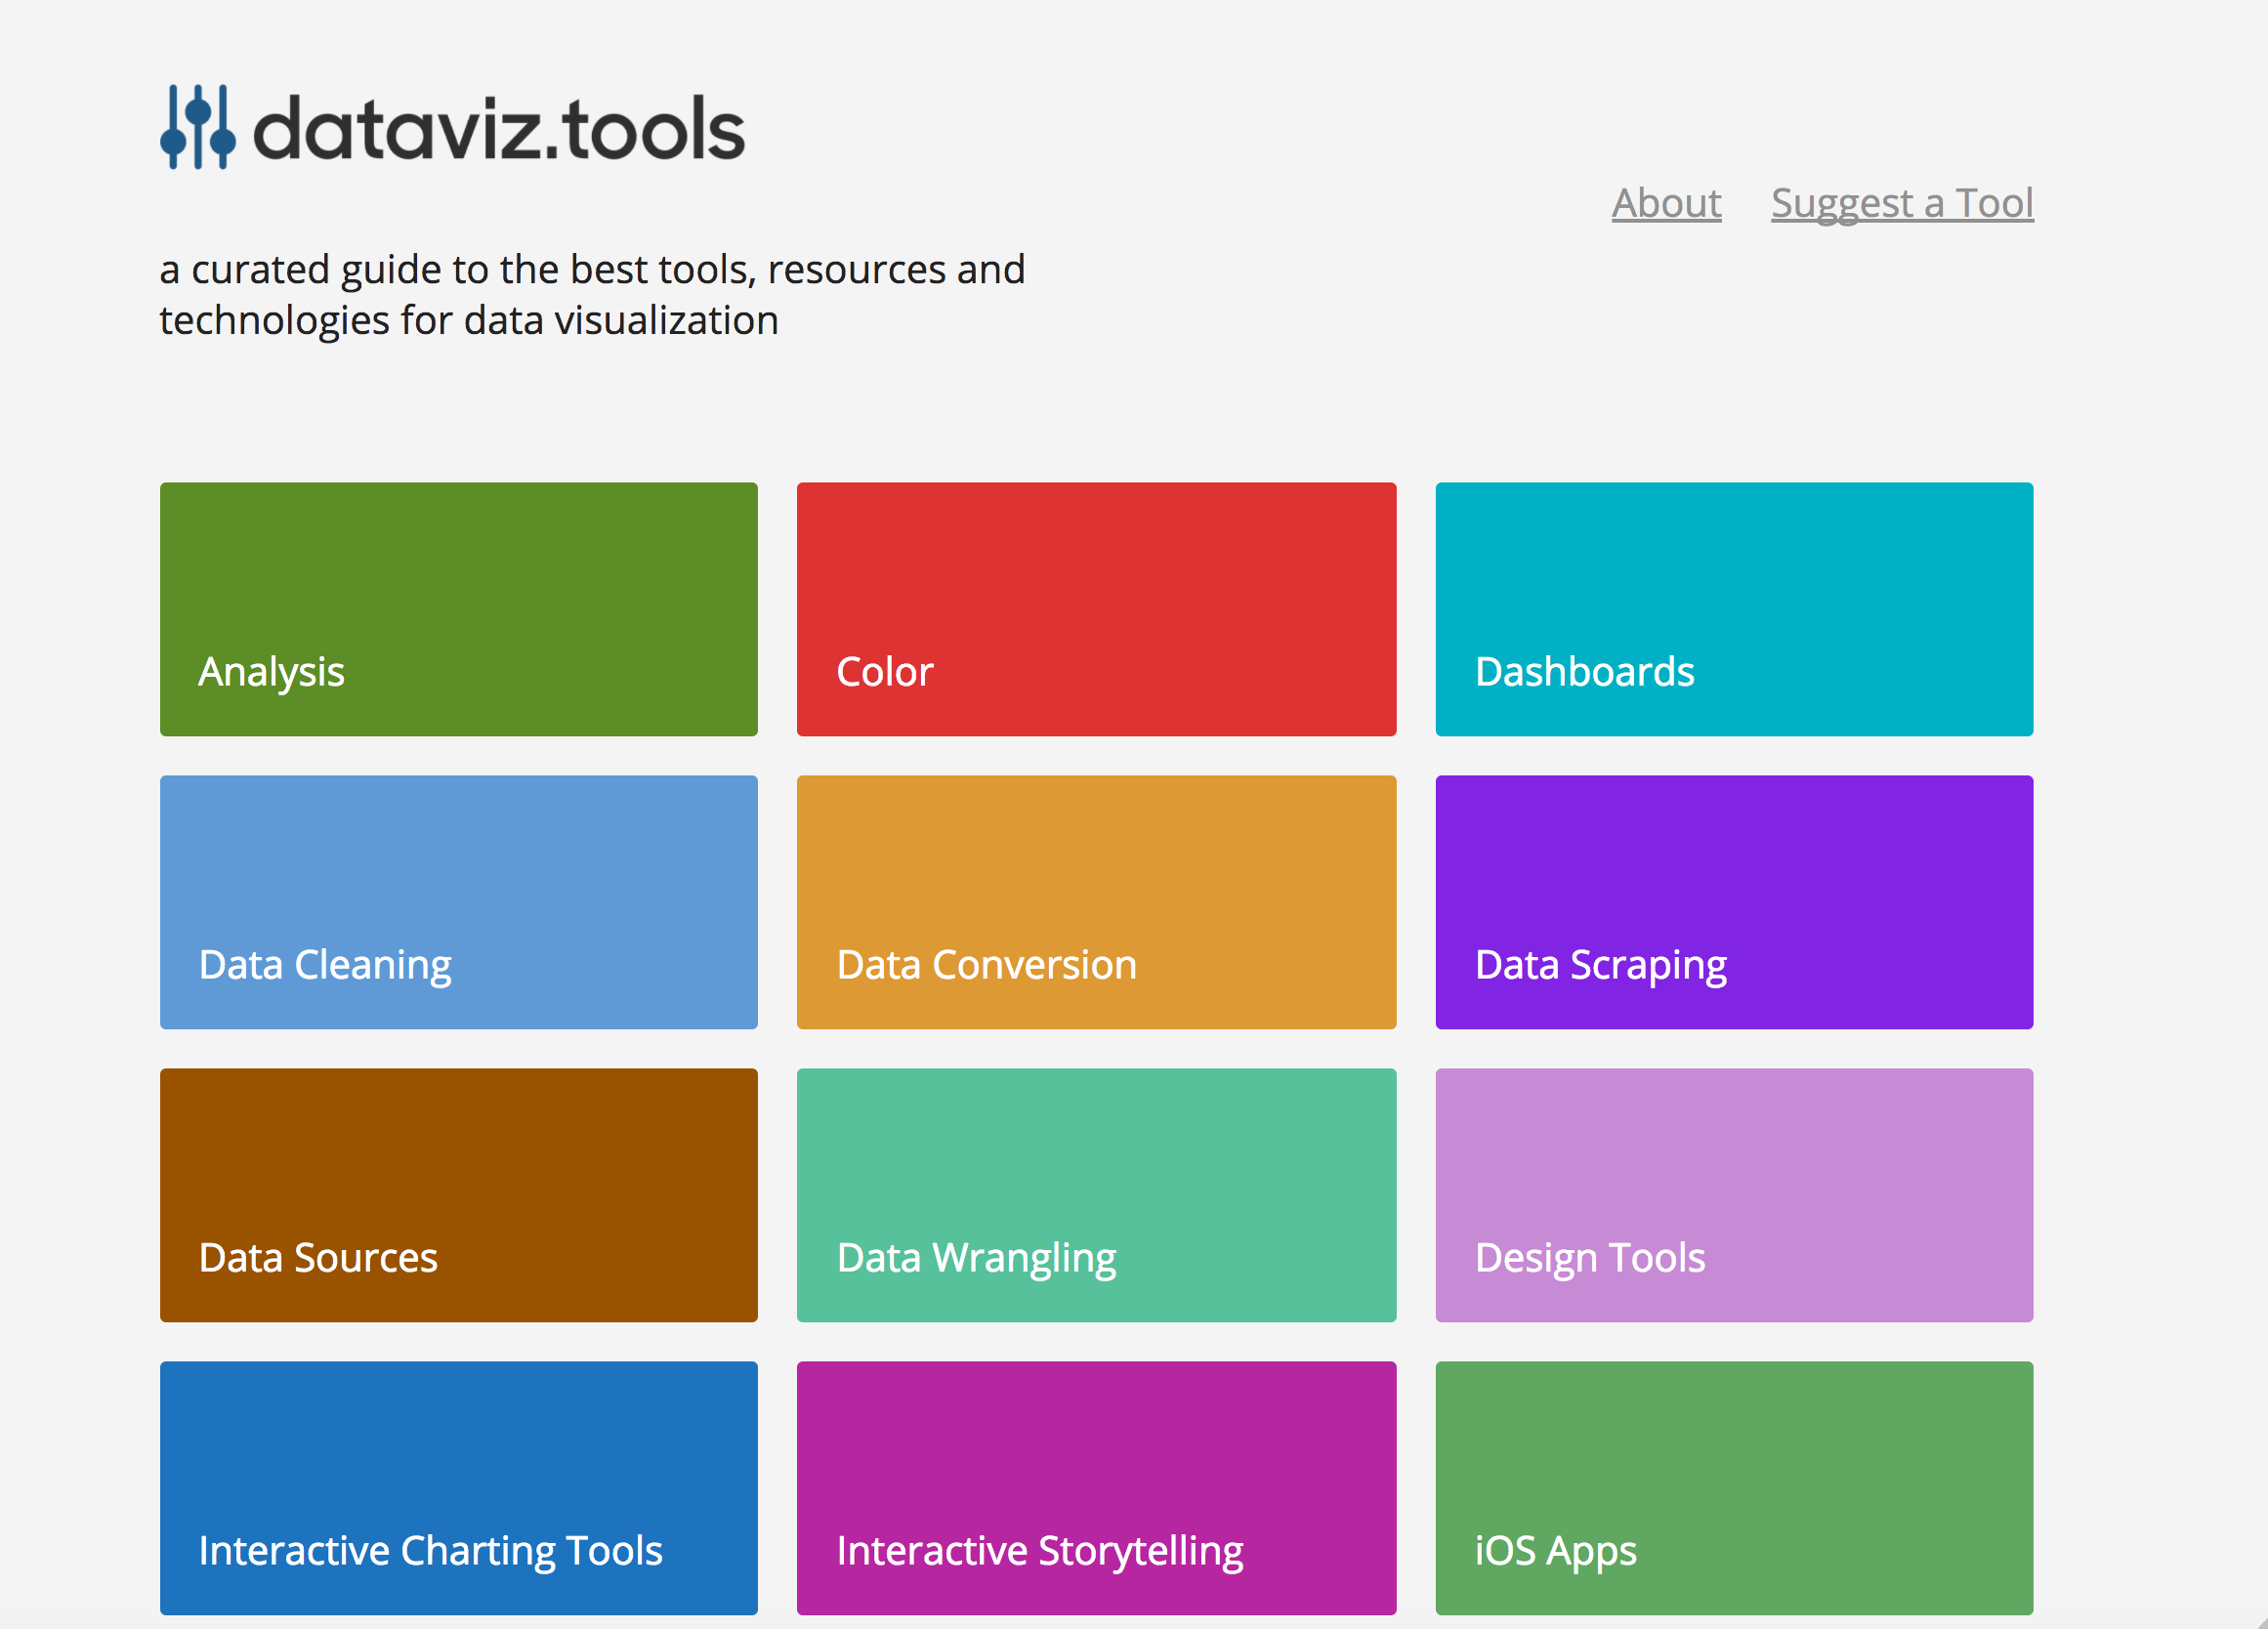 dataviz.tools▲409
Curated collection of the 400 best data visualization tools
2017 · dataviz.tools · its alternatives →
- 8

Reference tool for data visualisation
2016 · datavizcatalogue.com · its alternatives →
- 9GA
Hi everyone! Graphs is the intersection of data visualization and the daily web puzzle genre (Wordle, NYT Mini Crossword, Connections, etc.). Every day, you are given a nameless graph and 5 options to select the right dataset it is representing. Upon winning, you can access the underlying dataset and other info + maintain a streak and stats. It's super simple - check out today's chart and you should be able to get the gist quickly. My email + twitter account (@graphsgame) is on the page, would love a feedback or a follow. Don't hesitate to reach out!
2024 · graphs.world · its alternatives →
- 10
 Stat of the day▲249
Fascinating and important stats from the rest of world
2020 · restofworld.org · its alternatives →
- 11

- 12

A map of events & projects in the global GraphQL community
2017 · graphql-world.com · its alternatives →
- 13

Improve the way your users work with data
2017 · data.world · its alternatives →
- 14

- 15

- 16

Ideas, issues, knowledge, data — visualized!
2015 · informationisbeautiful.net · its alternatives →
- 17

A framework for 3D geospatial visualization in the browser - UDST/vizicities
2016 · github.com · its alternatives →
- 18WP
2014 · roadtolarissa.com · its alternatives →
- 19

I've been iterating on a small galaxy visualization project that originally started as a university course assignment, using only provided sample data (no real astronomical distances). Recently, I updated it to include redshift-based distance data, which makes the 3D structure more meaningful and closer to real large-scale galaxy distributions. Repo: https://github.com/Avicted/galaxy_visualization_raylib Demo video (3D navigation + galaxy structures): https://www.youtube.com/watch?v=fC83RDWuPvw Current state: - Written in C (C99 standard) using Raylib -…
2024 · github.com · its alternatives →
- 20
website collecting news from the field of data visualization
2017 · its alternatives →
- 21

The essential collection of visualisation resources
2017 · visualisingdata.com · its alternatives →
- 22
 Data USA▲12
The most comprehensive visualization of U.S. public data
2016 · datausa.io · its alternatives →
- 23
 ReKisstory▲13
Search & Visualize anything in time and space
2025 · rekisstory.labs.vu.nl · its alternatives →
- 24

A daily globe puzzle: guess the data planet is showing free
2025 · worldofthemaps.com · its alternatives →
Also compare
Ranked by how close each launch is in meaning, then by votes. Prices were read from each product’s own site when checked and can change. Refine with your own description →