Life & fun · alternatives · 2026

24 alternatives to ReKisstory
Search & Visualize anything in time and space
Below are 24 products that do a similar job, ranked by how close each is in meaning and then by launch-day votes. Prices are shown for the 1 we have checked on their own sites, 1 of them free or with a free tier.
- 1
 Atlas of Spacefree▲770
Hello HN! Sharing a recent side project of mine, the Atlas of Space, that I built out to explore the Solar System. As a long-time space nerd, I realized recently that I didn't have a good intuition on the scale, speed, and relative orientation of the celestial bodies around us. So over the break I built out a kind of spatial Wikipedia to click around and learn about planets, moons, asteroids, and other bodies orbiting the Sun. The physics is all simulated in the browser using simple Newtonian mechanics. There's a lot left to do from here, including modeling objects in non-Keplerian orbits…
2025 · atlasof.space · its alternatives →
- 2
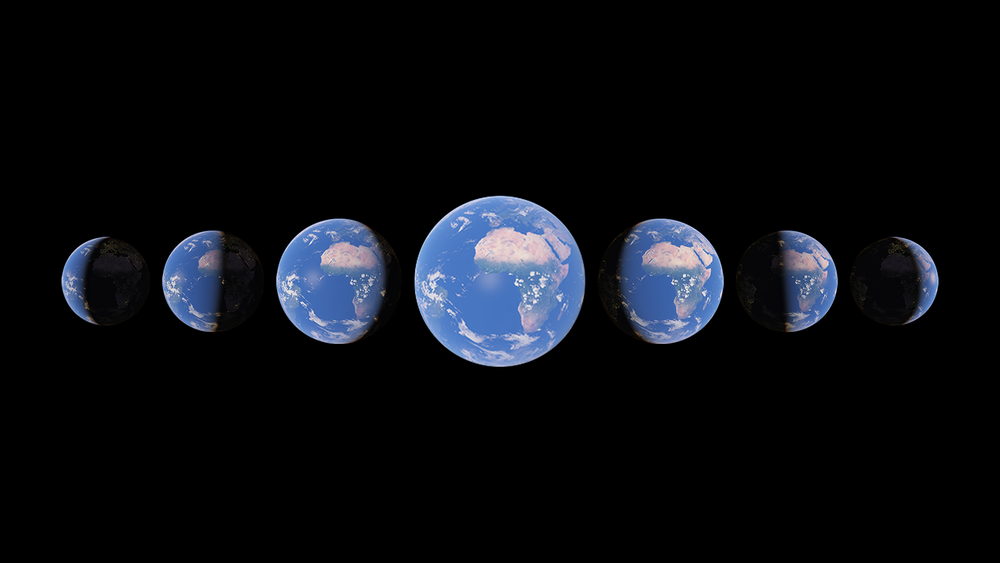
Watch time unfold and witness 40 years of planetary change
2021 · earth.google.com · its alternatives →
- 3
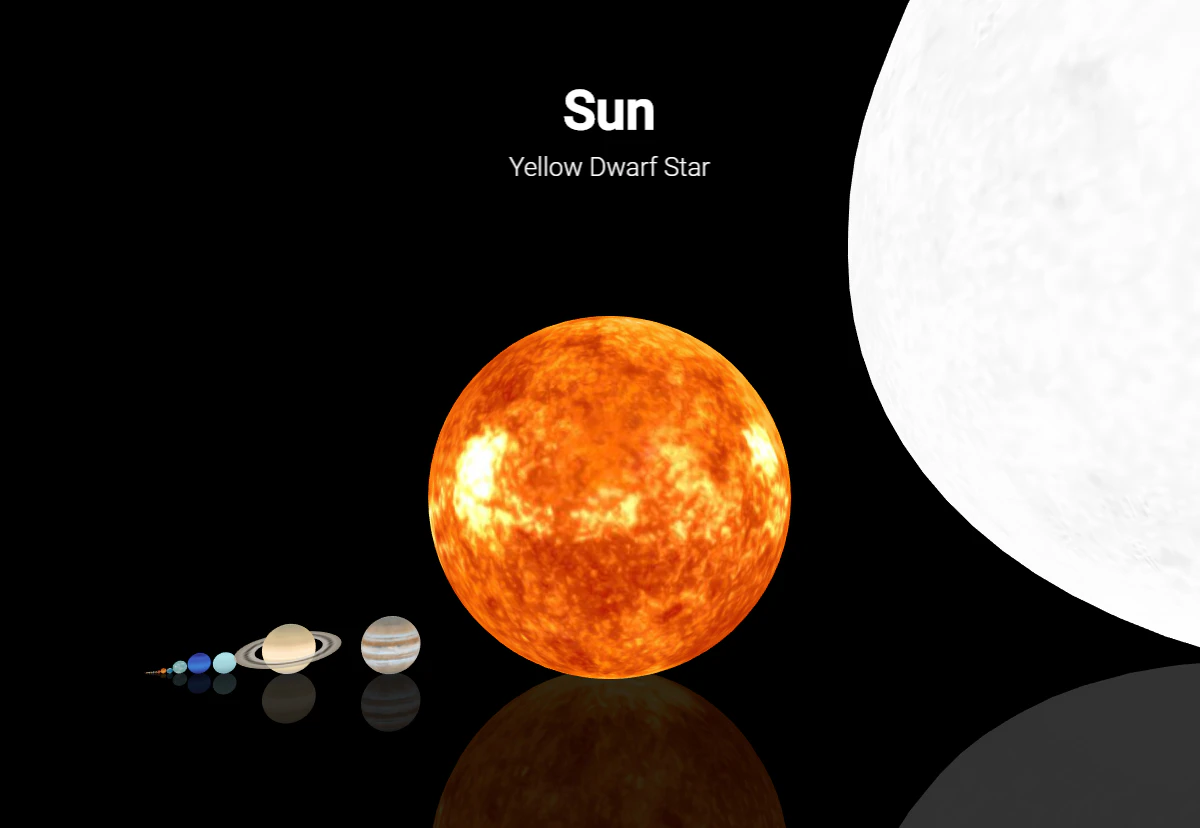
An interactive visualization of the universe
2019 · neal.fun · its alternatives →
- 4
 Eureka▲291
Turn any knowledge into an explorable visual map, AI-powered
Dec 2025 · eurekaweb.app · its alternatives →
- 5

- 6

Ideas, issues, knowledge, data — visualized!
2015 · informationisbeautiful.net · its alternatives →
- 7

- 8

- 9

Catalog of all chart types and tools to build them
2017 · visualizationuniverse.com · its alternatives →
- 10
 Globe of History▲189
I built Globe of History — an interactive 3D visualization of 6,000 years of human events, mapped onto the Earth’s surface. It includes 5,000+ data points covering wars, inventions, assassinations, natural disasters, and philosophers — spanning 4000 BCE → 2025 CE. The main goal was to build a visual entry point into history — not a database, but a way to instantly sense density and continuity over time. Stack / Process Python for scraping structured event data from Wikipedia/Wikidata Gemini 2.0 Flash for AI-based enrichment and multi-stage verification Mapbox GL JS + React (Vite)…
Nov 2025 · globeofhistory.com · its alternatives →
- 11
- 12

- 13

Explore the past, present and future of the space age
2024 · rocketlaunch.org · its alternatives →
- 14

Official NASA library, searchable by keywords and metadata
2017 · images.nasa.gov · its alternatives →
- 15
- 16

- 17

Explore over 200k historical markers, wherever you are!
2025 · explorehere.app · its alternatives →
- 18

Holds up a mirror to our time to see if search can keep up
2015 · amazon.com · its alternatives →
- 19

Beautifully visualize real-time search trends
2014 · trends.google.com · its alternatives →
- 20

- 21

Search millions of datasets on the web
2020 · datasetsearch.research.google.com · its alternatives →
- 22

The essential collection of visualisation resources
2017 · visualisingdata.com · its alternatives →
- 23
 Litmaps▲87
A visual workspace to discover and create quality research
2022 · litmaps.com · its alternatives →
- 24

Also compare
Ranked by how close each launch is in meaning, then by votes. Prices were read from each product’s own site when checked and can change. Refine with your own description →