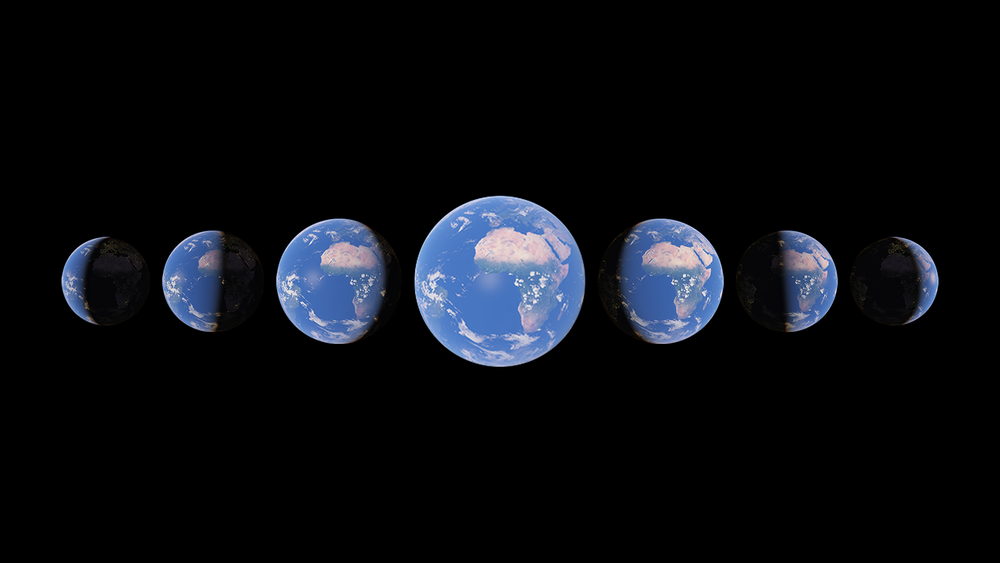
Timelapse in Google Earth
Watch time unfold and witness 40 years of planetary change
Timelapse in Google Earth launched on April 15, 2021 with 325 votes, #46 of 3,754 launches that month and more than 95% of that year's launches. The site was still online in September 2026, 5 years on.
In plain words
Timelapse in Google Earth lets users explore how the planet has changed over nearly four decades through an interactive 4D experience. The tool compiles 24 million satellite photos spanning 37 years into a searchable interface, allowing viewers to watch landscapes, cities, and natural features transform across time. It is designed for anyone interested in seeing visual evidence of planetary change, from climate researchers to educators to curious individuals wanting to observe specific locations near them.
written from the facts on this page · September 2026
From the sources
In the biggest update to Google Earth since 2017, you can now see our planet in an entirely new dimension — time. With Timelapse in Google Earth, 24 million satellite photos from the past 37 years have been compiled into an interactive 4D experience.
Aw snap! Google Earth isn't supported on your browser. You may need to update your browser or use a different browser. Please see our system requirements for more information. Chrome is a great choice and you can download it here . Or if you're feeling adventurous, you can try Earth anyway by choosing an optionfrom earth.google.com
Does a similar job
all alternatives →

 Plot modern addresses on Earth 240M years ago2018 · dinosaurpictures.org · ▲384
Earth looked very different long ago. Search for addresses across 750 million years of Earth
 Globe of HistoryNov 2025 · globeofhistory.com · ▲189
I built Globe of History — an interactive 3D visualization of 6,000 years of human events, mapped onto the Earth’s surface. It includes 5,000+ data points covering wars, inventions, assassinations, natural disasters, and philosophers — spanning 4000 BCE → 2025 CE. The main goal was to build a visual entry point into history — not a database, but a way to instantly sense density and continuity over time. Stack / Process Python for scraping structured event data from Wikipedia/Wikidata Gemini 2.0 Flash for AI-based enrichment and multi-stage verification Mapbox GL JS + React (Vite)…

 Live Sun and Moon Dashboard with NASA FootageApr 2026 · lumara-space.app · ▲224
Live NASA solar imagery in 12 wavelengths, the moon phase tonight for 200+ cities, and real space weather. Free on iOS and Android. No ads, no signup.
More life & fun this month
the category →
A free city-building game in your browser. You are the mayor. You know what the city needs. Now get it past the zoning board, the neighbors, the appeals court and the next election.
Life & fun · 22h ago · permit.petercai.com
- IV
Life & fun · 13d ago · tanzaniaeducationproject.org

Turn a phone, tablet or TV into a sign. Type a message and it fills the screen: welcome signs, timers, Wi-Fi passwords and more. No app, no account, free.
Life & fun · 14d ago · bigwords.page

Play a free virtual guitar online with your keyboard or by touch. Slow songs down and see every chord, string and strum. Acoustic, classic, electric and bass.
Life & fun · 8d ago · guitoro.com

Carrier settings from iPhone, Pixel and Galaxy firmware, decoded and compared: APNs, VoLTE, 5G and Wi-Fi Calling per carrier, and what each build changed.
Life & fun · 12d ago · carrierexplode.com

Life & fun · 22d ago · space.bl2.net
Source: Product Hunt launch ↗
Launched alongside, April 2021
the whole month →


Build your landing page with these 100+ tools
Growth · 2021 · landingpage.fyi
- PFPDFs from HTML▲742
Life & fun · 2021 · pdf.math.dev