Life & fun · alternatives · 2026
24 alternatives to World Population with D3
World Population with D3 is an interactive visualization tool that displays global population data through D3 charts and graphics. Launched in 2014, it helps users explore demographic trends and statistics through… Below are 24 products that do a similar job, ranked by how close each is in meaning and then by launch-day votes. World Population with D3 launched in 2014; newer entries below may have overtaken it.
- 1

2016 · github.com · its alternatives →
- 2IT
Experiments in expressing statistical thinking with interactive design
2015 · r2d3.us · its alternatives →
- 3DL
2015 · learnforeverlearn.com · its alternatives →
- 4WT
2013 · jasondavies.com · its alternatives →
- 5

An interactive data visualisation about Exoplanets by TK Vishal
2019 · exoplanetexplore.now.sh · its alternatives →
- 6SC
2015 · statisticalatlas.com · its alternatives →
- 7
 dataviz.tools▲409
Curated collection of the 400 best data visualization tools
2017 · dataviz.tools · its alternatives →
- 8

3D geographic visualization library. Contribute to w3reality/three-geo development by creating an account on GitHub.
2018 · github.com · its alternatives →
- 9G3
I made a web app to generate 3D models of real places on earth from land cover and elevation data. Click anywhere on the map to get a polygon, and then click "generate". It should work at most scales, but if your watershed or region selection is too large, the result can be less exciting because it's so flat. As a warning, the 3D models can sometimes be too much for my phone. It's nicer on desktop. I'm still working better on mobile support. The land cover data I'm using gives a cool effect, but at some point I'd like to add in global imagery and clouds. The backend is a Python thread…
2025 · topography.jessekv.com · its alternatives →
- 10

- 11

GitHub Gist: instantly share code, notes, and snippets.
2013 · bl.ocks.org · its alternatives →
- 12
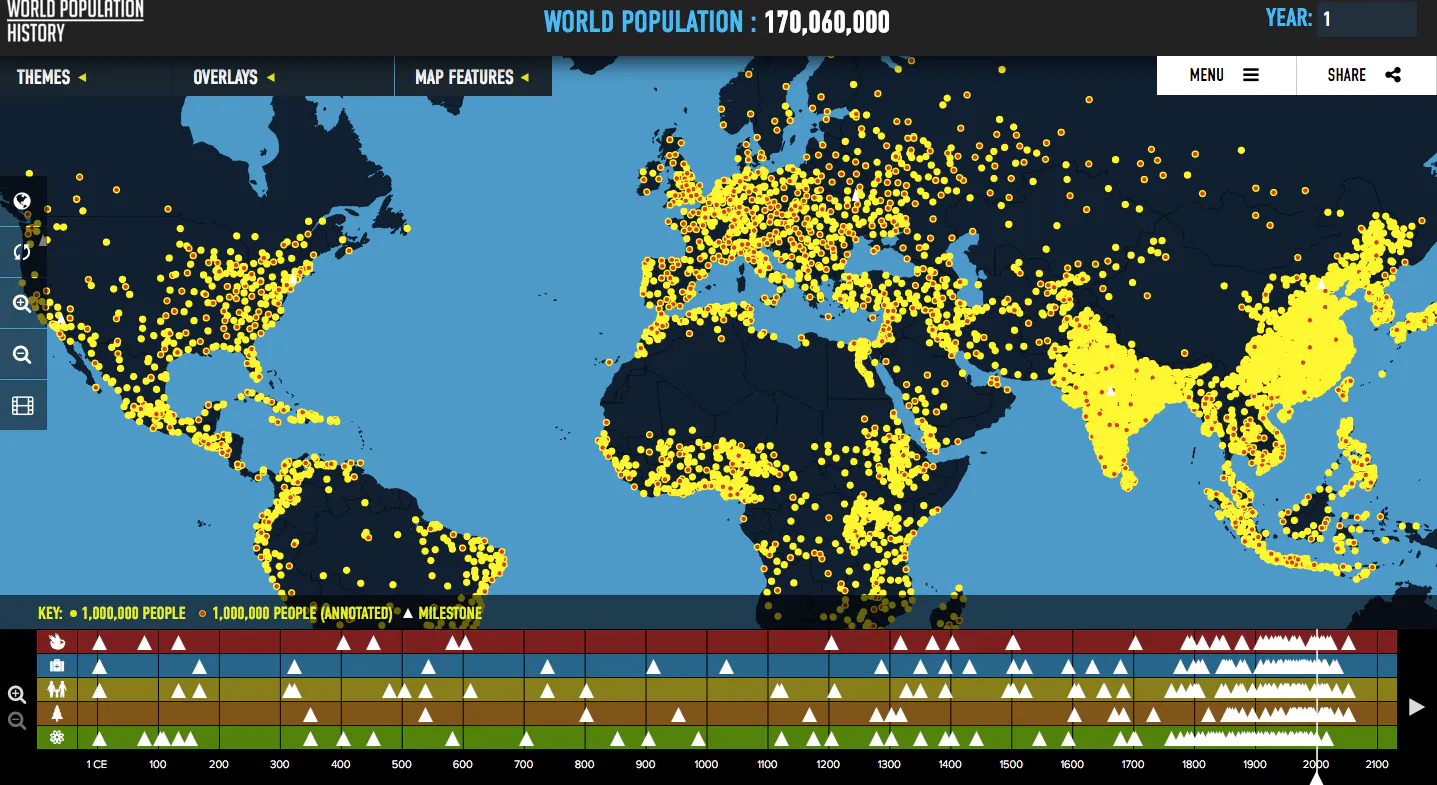
Visualizes global population trends over the last two thousa
2016 · worldpopulationhistory.org · its alternatives →
- 13GR
I built this as part of my quest to properly learn data visualization. The code is the easy part! Some lessons learned: - personal verification of the the general truth that pie charts are tough! and the returns are not great for the effort due to people's difficulties perceiving angles - may not use "vanilla" d3 with no React. was difficult to adapt for mobile - the GitHub API provides fairly standardized responses so building dynamic charts wasn't too bad. But when working with streaming data (say Kafka) I can see this getting interesting... schema registry should help but creating a view…
2024 · see-my-repo.netlify.app · its alternatives →
- 14

- 15
 Creately 3.0▲365
The simplest way to visualize ideas, plans & processes
2020 · creately.com · its alternatives →
- 16IA
2012 · latentflip.github.com · its alternatives →
- 17

Over the weekend I was discussing the latest news relating to open weights with some of my non-techie friends. After 30 mins of waffling, I realised it is quite a long and interesting story, with many twists and turns. I've always wanted to create a 'long scroll' story, but have never found a suitable story to tell. This felt like a fun weekend project to undertake. The story itself doesn't have too many scroll effects (which is probably a good thing), it was more about trying to tell a story with a certain style that wouldn't really fit on my personal blog. Would love to get your feedback…
2020 · blog.scottlogic.com · its alternatives →
- 18MG
2012 · guildwars2viz.com · its alternatives →
- 19MR
2013 · matthewisabel.com · its alternatives →
- 20FP
2015 · maurizzzio.github.io · its alternatives →
- 21

Reference tool for data visualisation
2016 · datavizcatalogue.com · its alternatives →
- 22

Globe wireframe visualizations in Golang. Contribute to mmcloughlin/globe development by creating an account on GitHub.
2017 · github.com · its alternatives →
- 23

Many JS libraries exist to build graphs on the web (Vega, chartJS, Plotly...). They allow to make charts quickly. But you lose flexibility: you're limited by the options they offer. I just created a gallery with hundreds of graphs made with d3.js and React. - Examples are split by graph types - They all come with explanation and code sandboxes - Gradual complexity to ease the learning curve It took me ages to create this project! Feedback welcome!
2023 · react-graph-gallery.com · its alternatives →
- 24TS
I've been working on a dashboard and found a data set that would look great represented as a discrete sparkline. This type of visualization ...
2016 · dataviztalk.blogspot.com · its alternatives →
Also compare
- D3 TimelineChart alternatives
- Intro to Machine Learning in Interactive D3.js Visualizations alternatives
- Displaying Lifespan Info in a D3 Family Tree Visualization alternatives
- Word Tree in D3.js alternatives
- Exoplanets Data Visualisation Using D3.js alternatives
- StatisticalAtlas.com: demographic charts and maps down to the city block alternatives
Ranked by how close each launch is in meaning, then by votes. Prices were read from each product’s own site when checked and can change. Refine with your own description →