Life & fun · alternatives · 2026

24 alternatives to D3 TimelineChart
D3 TimelineChart is a visualization tool for creating timeline charts using the D3 library. It's designed for developers and data analysts who need to display temporal data and events in an interactive, graphical… Below are 24 products that do a similar job, ranked by how close each is in meaning and then by launch-day votes. D3 TimelineChart launched in 2016; newer entries below may have overtaken it.
- 1
 My Journey▲297
Visualize your whole life through a 3D Timeline
2024 · myjourney-timeline.com · its alternatives →
- 2

- 3P3
2020 · leeoniya.github.io · its alternatives →
- 4

Create pro-level graphs that drive actions
2024 · graphy.app · its alternatives →
- 5WT
2013 · jasondavies.com · its alternatives →
- 6

2024 · markwhen.com · its alternatives →
- 7

GitHub Gist: instantly share code, notes, and snippets.
2013 · bl.ocks.org · its alternatives →
- 8WP
2014 · roadtolarissa.com · its alternatives →
- 9TL
2018 · charts.com · its alternatives →
- 10

Open source D3.js-based charting and visualization library for data exploration and data analysis
2015 · taucharts.com · its alternatives →
- 11CA
2011 · timekiwi.com · its alternatives →
- 12

Many JS libraries exist to build graphs on the web (Vega, chartJS, Plotly...). They allow to make charts quickly. But you lose flexibility: you're limited by the options they offer. I just created a gallery with hundreds of graphs made with d3.js and React. - Examples are split by graph types - They all come with explanation and code sandboxes - Gradual complexity to ease the learning curve It took me ages to create this project! Feedback welcome!
2023 · react-graph-gallery.com · its alternatives →
- 13TA
2022 · observablehq.com · its alternatives →
- 14

- 15
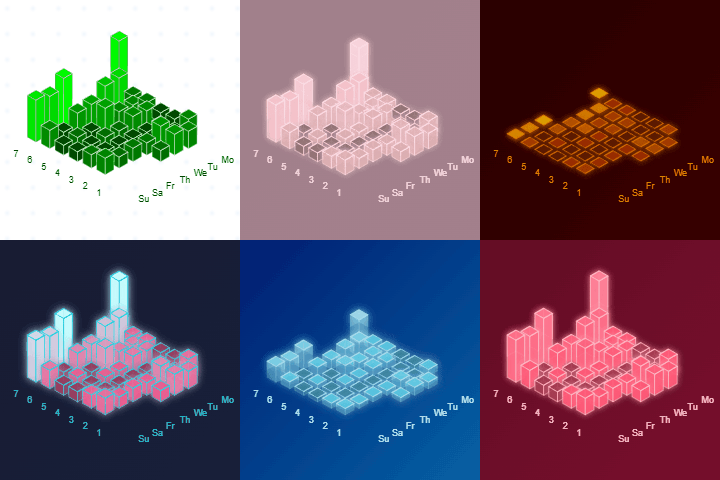
Visualize your weekly activity on Bluesky in a 3D chart
2025 · bluesky-3d-graph.vercel.app · its alternatives →
- 16IA
2012 · latentflip.github.com · its alternatives →
- 17GR
I built this as part of my quest to properly learn data visualization. The code is the easy part! Some lessons learned: - personal verification of the the general truth that pie charts are tough! and the returns are not great for the effort due to people's difficulties perceiving angles - may not use "vanilla" d3 with no React. was difficult to adapt for mobile - the GitHub API provides fairly standardized responses so building dynamic charts wasn't too bad. But when working with streaming data (say Kafka) I can see this getting interesting... schema registry should help but creating a view…
2024 · see-my-repo.netlify.app · its alternatives →
- 18CT
2021 · cascade.page · its alternatives →
- 19

Reference tool for data visualisation
2016 · datavizcatalogue.com · its alternatives →
- 20

3D geographic visualization library. Contribute to w3reality/three-geo development by creating an account on GitHub.
2018 · github.com · its alternatives →
- 21

Catalog of all chart types and tools to build them
2017 · visualizationuniverse.com · its alternatives →
- 22

- 23
 Chartbrew v2▲197
Visualize data from all your data sources in one place
2022 · chartbrew.com · its alternatives →
- 24

Also compare
Ranked by how close each launch is in meaning, then by votes. Prices were read from each product’s own site when checked and can change. Refine with your own description →