Growth · alternatives · 2026

24 alternatives to 3D Bluesky Chart
Visualize your weekly activity on Bluesky in a 3D chart
Below are 24 products that do a similar job, ranked by how close each is in meaning and then by launch-day votes.
- 1
 3D Charts▲98
80 stylish 3D illustrations for design projects
2021 · charts.wannathis.one · its alternatives →
- 2

- 3

Create pro-level graphs that drive actions
2024 · graphy.app · its alternatives →
- 4

Free analytics tool to track your Bluesky followers
2024 · blueskycounter.com · its alternatives →
- 5

- 6

2016 · github.com · its alternatives →
- 7

I’ve curated and organized Bluesky feeds into 50+ categories, now with growth rankings for the past day and week! Check it out and share your thoughts!
2025 · bskyinfo.com · its alternatives →
- 8

Many JS libraries exist to build graphs on the web (Vega, chartJS, Plotly...). They allow to make charts quickly. But you lose flexibility: you're limited by the options they offer. I just created a gallery with hundreds of graphs made with d3.js and React. - Examples are split by graph types - They all come with explanation and code sandboxes - Gradual complexity to ease the learning curve It took me ages to create this project! Feedback welcome!
2023 · react-graph-gallery.com · its alternatives →
- 9

- 10
- 11

- 12

Catalog of all chart types and tools to build them
2017 · visualizationuniverse.com · its alternatives →
- 13
 Vizzu▲225
Open-source JS library to build animated charts with ease
2022 · vizzu.io · its alternatives →
- 14VG
2020 · treksit.netlify.app · its alternatives →
- 15
 Gym Graphs▲202
Track your gym progress with graphs and stats
2024 · gym-graphs.vercel.app · its alternatives →
- 16
 NPM Chart▲158
Search for a npm package to see its download stats over time
2024 · npm.chart.dev · its alternatives →
- 17

- 18
- 19
 Slack Stats▲117
A weekly infographic report of your Slack stats
2016 · rocketgraph.com · its alternatives →
- 20

Easily craft nice-looking social media charts for your data
2023 · snygg-graphics.vercel.app · its alternatives →
- 21

- 22
 Tweetable Charts▲169
Create text based charts you can directly embed on Twitter
2021 · tweetable-charts.agiliq.com · its alternatives →
- 23

- 24
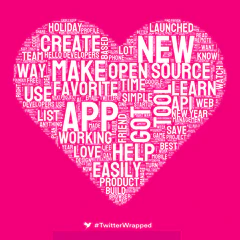
Your 2019 on Twitter visualized in a beautiful word cloud.
2019 · its alternatives →
Also compare
Ranked by how close each launch is in meaning, then by votes. Prices were read from each product’s own site when checked and can change. Refine with your own description →