Life & fun · alternatives · 2026
24 alternatives to Mortality Rates in the US Visualized
Mortality Rates in the US Visualized is an interactive tool that displays death statistics across the United States. Launched in 2013, it presents data on how mortality rates vary by region and demographic factors. The… Below are 24 products that do a similar job, ranked by how close each is in meaning and then by launch-day votes. Mortality Rates in the US Visualized launched in 2013; newer entries below may have overtaken it.
- 1
 dataviz.tools▲409
Curated collection of the 400 best data visualization tools
2017 · dataviz.tools · its alternatives →
- 2WP
2014 · roadtolarissa.com · its alternatives →
- 3

A stark reminder of the finiteness of life
2019 · failflow.com · its alternatives →
- 4DV
2017 · dvblogger.com · its alternatives →
- 5

- 6P3
2020 · leeoniya.github.io · its alternatives →
- 7
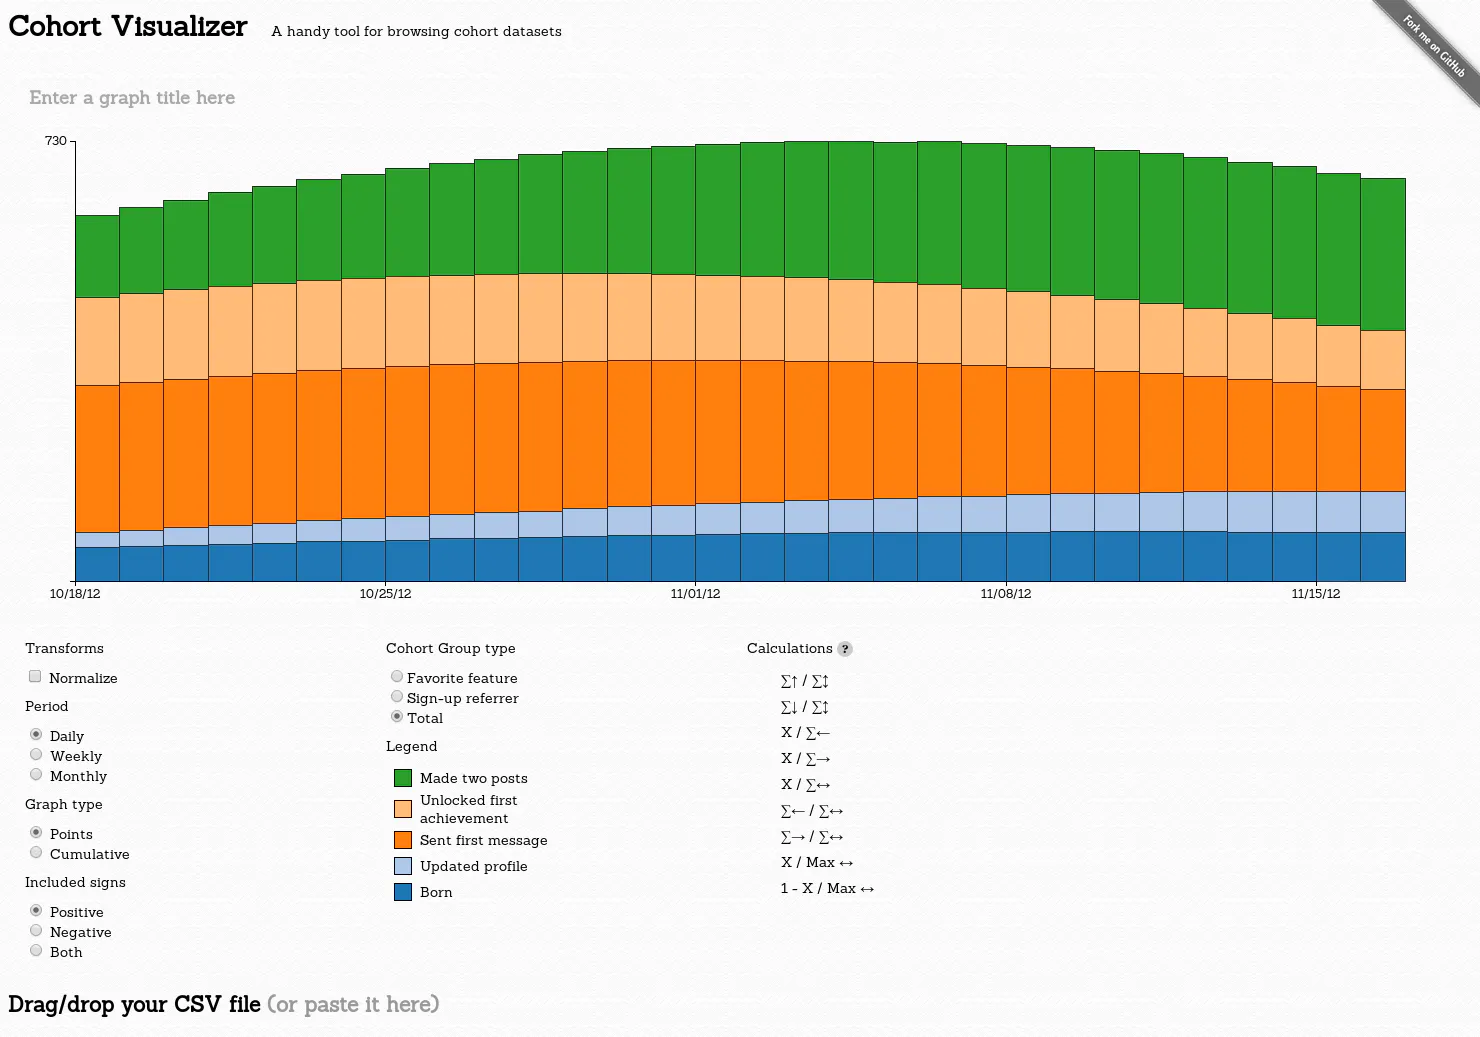
A handy tool for browsing cohort datasets
2014 · bslatkin.github.io · its alternatives →
- 8AT
2014 · seeyourvisitors.com · its alternatives →
- 9VY
2020 · lifeinweeks.info · its alternatives →
- 10
 Data USA▲12
The most comprehensive visualization of U.S. public data
2016 · datausa.io · its alternatives →
- 11
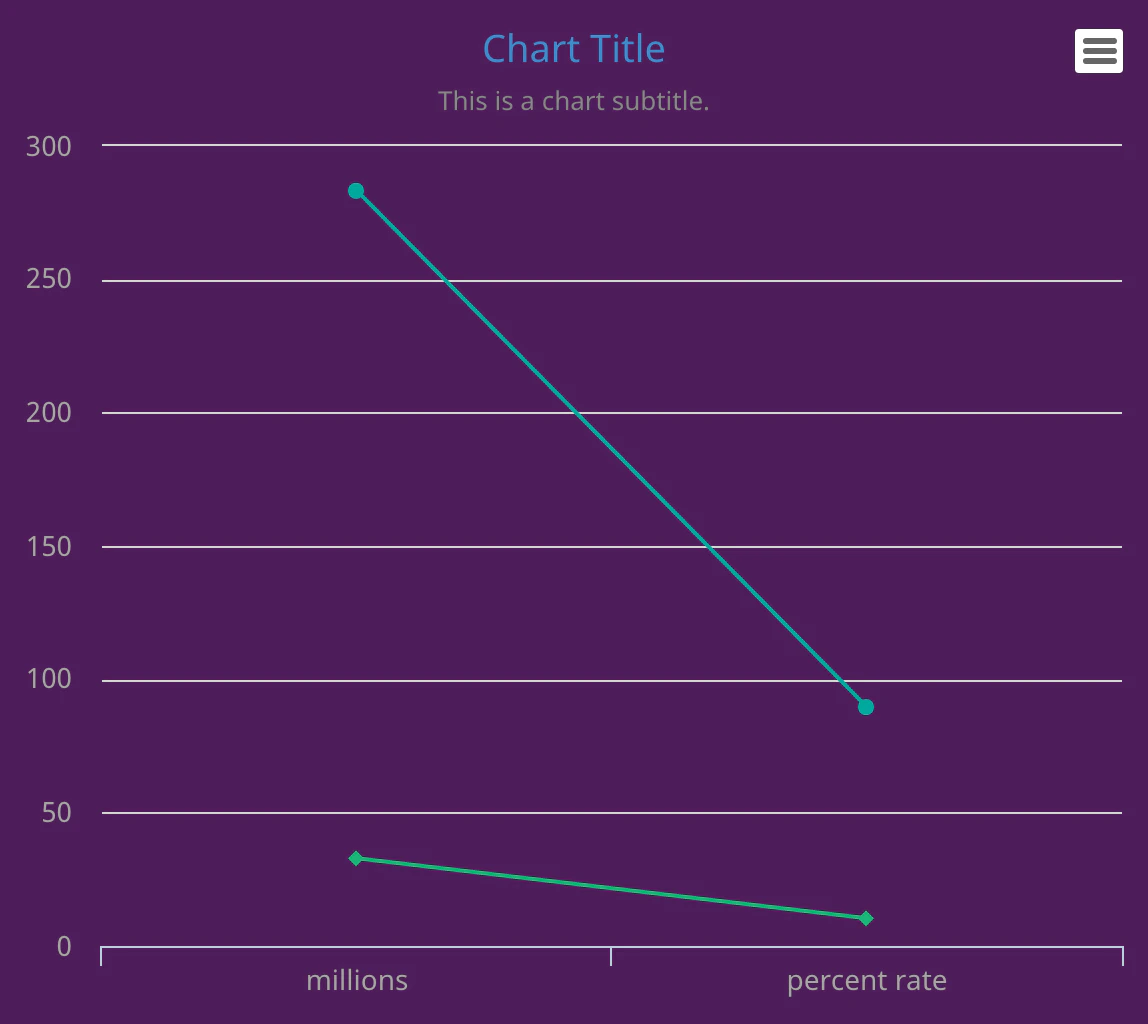 Statpedia▲125
Simple chart creation tool, create one in seconds.
2016 · statpedia.com · its alternatives →
- 12
 Open Census Data▲182
Visualize & download neighborhood demographic Insights
2018 · safegraph.com · its alternatives →
- 13MF
I downloaded the MSHA's (Mine Safety and Health Administration) public datasets and create a visualization of all the mines in the US complete with the operators and details on each site.
Feb 2026 · mines.fyi · its alternatives →
- 14

Interactive U.S. state data visualization platform
May 2026 · statestats.us · its alternatives →
- 15

Charts and infographics constructor in Figma
2021 · store.123d.one · its alternatives →
- 16SC
2015 · statisticalatlas.com · its alternatives →
- 17

Reference tool for data visualisation
2016 · datavizcatalogue.com · its alternatives →
- 18MO
2018 · anvaka.github.io · its alternatives →
- 19BV
2012 · friggeri.net · its alternatives →
- 20

- 21SB
2017 · martin.varela.fi · its alternatives →
- 22

- 23

Analyze remote work trends for U.S. cities with census data
2019 · pragli.com · its alternatives →
- 24

Precise & visual representation of months you've lived.
2016 · chromewebstore.google.com · its alternatives →
Also compare
Ranked by how close each launch is in meaning, then by votes. Prices were read from each product’s own site when checked and can change. Refine with your own description →