Cohort Visualizer
A handy tool for browsing cohort datasets
Cohort Visualizer launched on June 24, 2014 with 99 votes, #236 of 1,531 launches that month and more than 75% of that year's launches. The site was still online in September 2026, 12 years on.
What it does
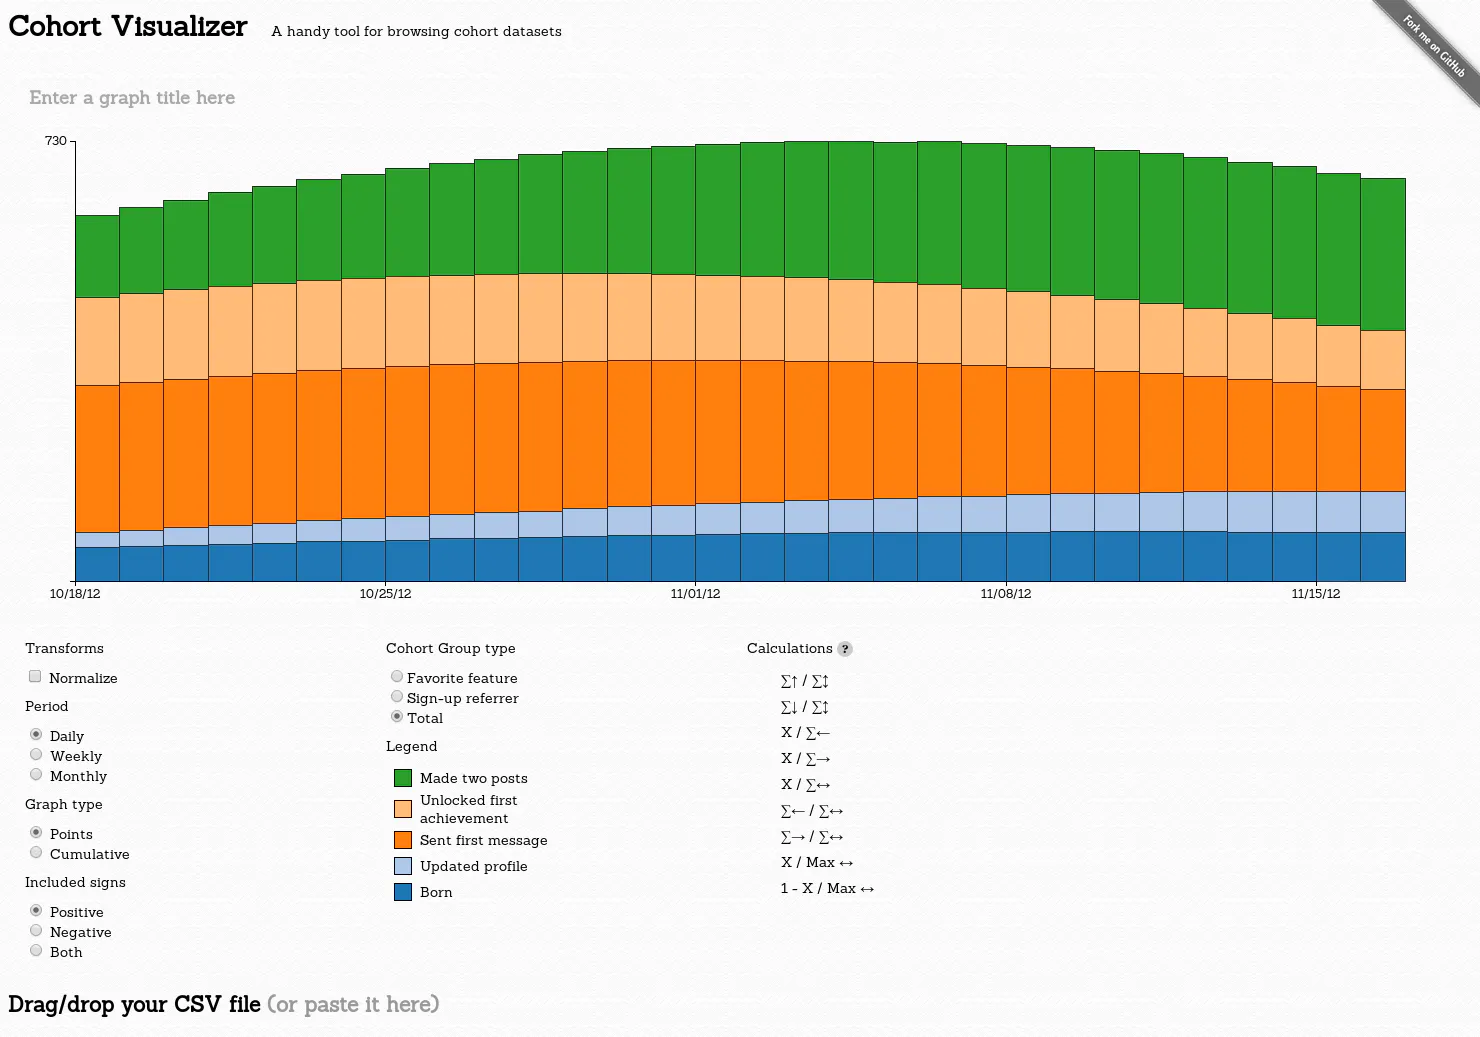
A cohort is a group of people who share a common characteristic or experience within a defined period. This is a handy tool for browsing cohort datasets.
Note: No data will go to the server. This is all client-side in your browser. Format is comma-separated with quotes like Excel. A guide to columns: First row is used to name the various user states you have. It should be in the format "Cohort group type,Cohort group value,Cohort day,State1 name,State2 name,...". The dataset may have the same user appear in many rows that are of different group types. What's important is for each group type the user is only in one row with one group value; aka the tuple (group value, cohort day) should be a unique row for each cohort group type. Order of the rows does not matter. Here's a simple example for a fake social network with "Sign-up Referrer",…from bslatkin.github.io
Does a similar job
all alternatives →
 ChartMogul Cohorts2015 · chartmogul.com · ▲95
One-click Cohort Analysis for SaaS & subscription businesses



More life & fun this month
the category →
A free city-building game in your browser. You are the mayor. You know what the city needs. Now get it past the zoning board, the neighbors, the appeals court and the next election.
Life & fun · 1d ago · permit.petercai.com
- IV
Life & fun · 13d ago · tanzaniaeducationproject.org

Turn a phone, tablet or TV into a sign. Type a message and it fills the screen: welcome signs, timers, Wi-Fi passwords and more. No app, no account, free.
Life & fun · 14d ago · bigwords.page

Play a free virtual guitar online with your keyboard or by touch. Slow songs down and see every chord, string and strum. Acoustic, classic, electric and bass.
Life & fun · 8d ago · guitoro.com

Carrier settings from iPhone, Pixel and Galaxy firmware, decoded and compared: APNs, VoLTE, 5G and Wi-Fi Calling per carrier, and what each build changed.
Life & fun · 12d ago · carrierexplode.com

Life & fun · 22d ago · space.bl2.net
Source: Product Hunt launch ↗
Launched alongside, June 2014
the whole month →
- WD
Life & fun · 2014 · wavepot.com

- WP
Life & fun · 2014 · blog.evilwindowdog.com
- CA
Life & fun · 2014 · jessepollak.github.io

Faster user-land reimplementations for several common builtin native JavaScript functions. - codemix/fast.js
Life & fun · 2014 · github.com