Life & fun · alternatives · 2026
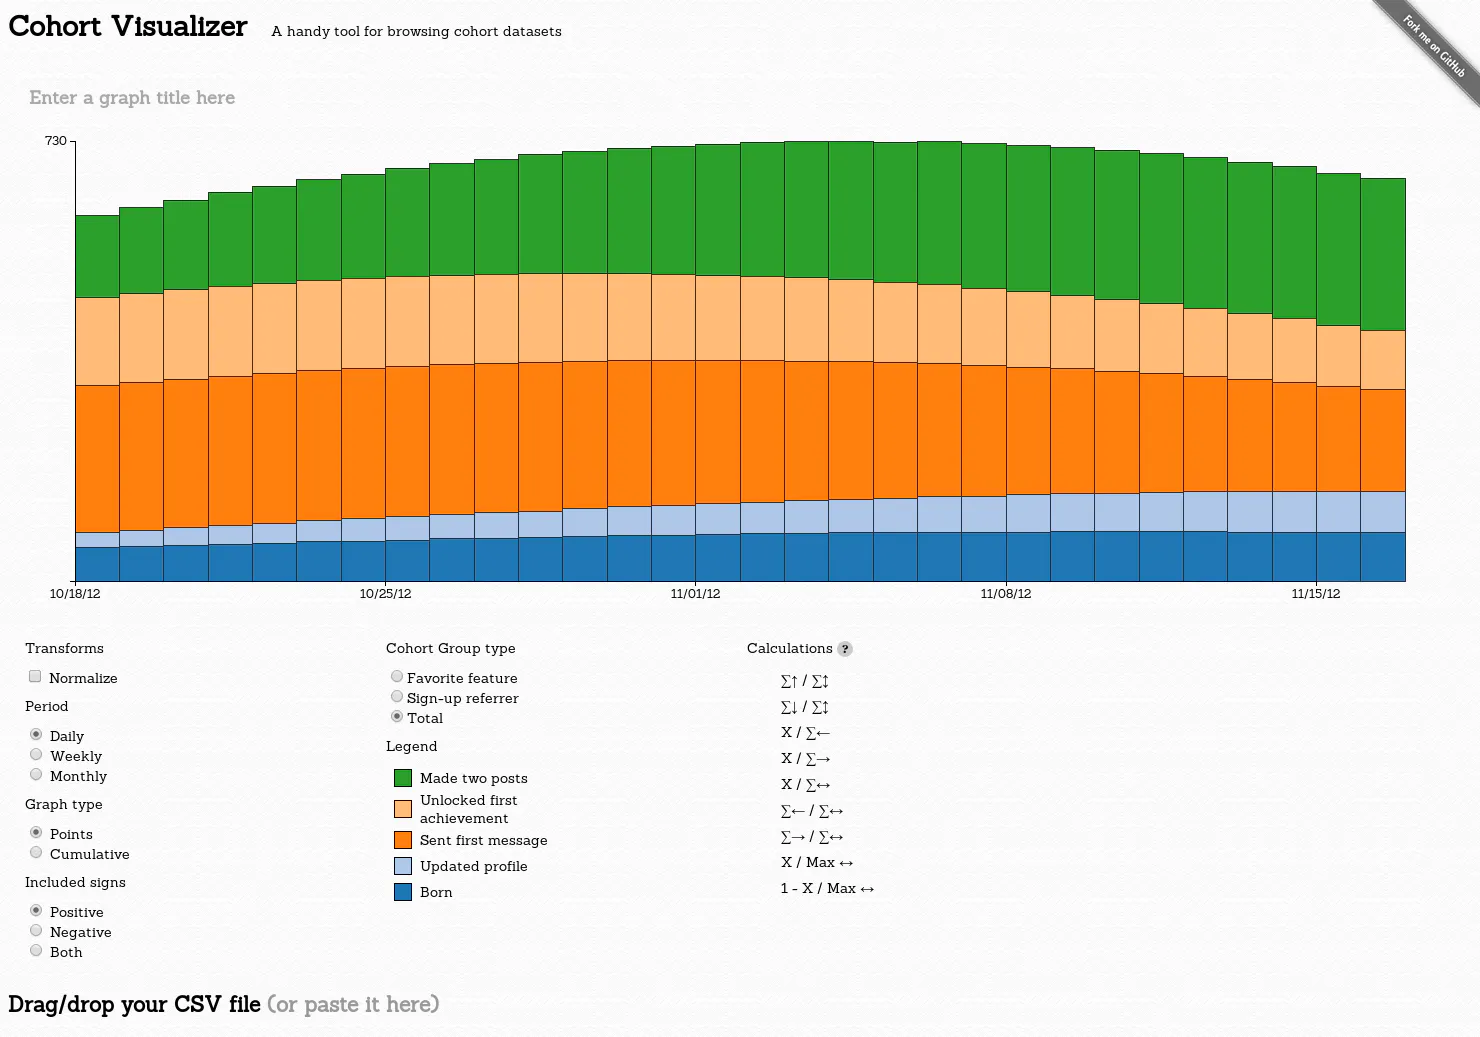
24 alternatives to Cohort Visualizer
A handy tool for browsing cohort datasets
Below are 24 products that do a similar job, ranked by how close each is in meaning and then by launch-day votes. Cohort Visualizer launched in 2014; newer entries below may have overtaken it.
- 1

Quickly build and visualize beautiful cohort analyses
2016 · keen.github.io · its alternatives →
- 2

One-click Cohort Analysis for SaaS & subscription businesses
2015 · chartmogul.com · its alternatives →
- 3

- 4
 Woopra▲76
Event tracking, funnels and cohort analysis in real time
2014 · woopra.com · its alternatives →
- 5

- 6
 MakeCohort▲82
Create Cohort analysis online with just a simple CSV file
2022 · makecohort.com · its alternatives →
- 7

The future of online data visualization tools
2016 · policyviz.com · its alternatives →
- 8

- 9
- 10

- 11Variance▲91
Build powerful data visualizations for the web.
2014 · variancecharts.com · its alternatives →
- 12ND
2014 · blog.spritesapp.com · its alternatives →
- 13
 Growthverse▲233
An interactive visualization of marketing tech tools
2015 · growthverse.com · its alternatives →
- 14

- 15

- 16

Hi HN! I've found this visualization tool immensely helpful over the years for getting an intuition for how an LLM "sees" some piece of text, and with a bit of elbow grease decided to move all compute to client side so I could make it publicly available. I've found it particularly useful for - Understanding exactly how repetition and patterns affect a small LM's ability to predict correctly - Understanding different tokenization patterns and how it affects model output - Getting a general sense of how "hard" different prediction tasks are for GPT-style models Known problems (that I probably…
2023 · perplexity.vercel.app · its alternatives →
- 17

Beautifully visualize real-time search trends
2014 · trends.google.com · its alternatives →
- 18

Everything you wanted to know about cohort analysis
2023 · drive.google.com · its alternatives →
- 19
- 20
How to think about data
2015 · amazon.com · its alternatives →
- 21

- 22

- 23

Visualizing the extraordinary Big Data revolution
2015 · lightshow.lol · its alternatives →
- 24

Also compare
Ranked by how close each launch is in meaning, then by votes. Prices were read from each product’s own site when checked and can change. Refine with your own description →