Life & fun · alternatives · 2026
24 alternatives to Beautiful Visualization of Agreement Groups in the US Senate
Beautiful Visualization of Agreement Groups in the US Senate is a tool that maps voting patterns among US senators to show which lawmakers align on legislative issues. Launched in 2012, it presents Senate voting data… Below are 24 products that do a similar job, ranked by how close each is in meaning and then by launch-day votes. Beautiful Visualization of Agreement Groups in the US Senate launched in 2012; newer entries below may have overtaken it.
- 1VR
2013 · static.davidchouinard.com · its alternatives →
- 2FM
2013 · congressbuddies.com · its alternatives →
- 3TL
2018 · charts.com · its alternatives →
- 4

Construisons ensemble un tableau de bord de données neutres et vérifiables
2022 · lafrance.enchiffres.fr · its alternatives →
- 5IM
2017 · xyz.insightdataengineering.com · its alternatives →
- 6

Free JavaScript library for data visualization & analysis
2019 · webdatarocks.com · its alternatives →
- 7

Hello, guys~ I recently developed a data exploration and visualization app which can be used as a different type of open-source alternative to Tableau. It is extremely easy to embed in your apps just as a react component. The original purpose is to develop a lite plugin that can be easily embedded in most cases, it doesn't have to be a large BI, but a lite graphic plugin. GitHub: Kanaries/graphic-walker, https://github.com/Kanaries/graphic-walker The main features implemented: * A user-friendly drag-and-drop-based interaction for exploratory data analysis with…
2023 · github.com · its alternatives →
- 8VG
2020 · treksit.netlify.app · its alternatives →
- 9

Optimization software to fight gerrymandering.
2020 · antimander.org · its alternatives →
- 10

We built Sortabase to let communities collaborate on visual databases of the things they know and care about. The fields of each database are defined by its moderators using a no-code drag-n-drop interface, and the resulting database is easy to search, filter, sort, and contribute to. The platform is 100% free to use - take a look, and feedback is appreciated!
2023 · sortabase.com · its alternatives →
- 11

The future of online data visualization tools
2016 · policyviz.com · its alternatives →
- 12MO
2018 · anvaka.github.io · its alternatives →
- 13GP
2016 · veniversum.github.io · its alternatives →
- 14
 MyCongress▲70
An app that brings Congressional data to your fingertips.
2019 · mycongress.vercel.app · its alternatives →
- 15VT
2017 · match.patronage.org · its alternatives →
- 16
 VoteSee▲15
Learn how Congressional Representatives vote on key issues.
2024 · votesee.org · its alternatives →
- 17
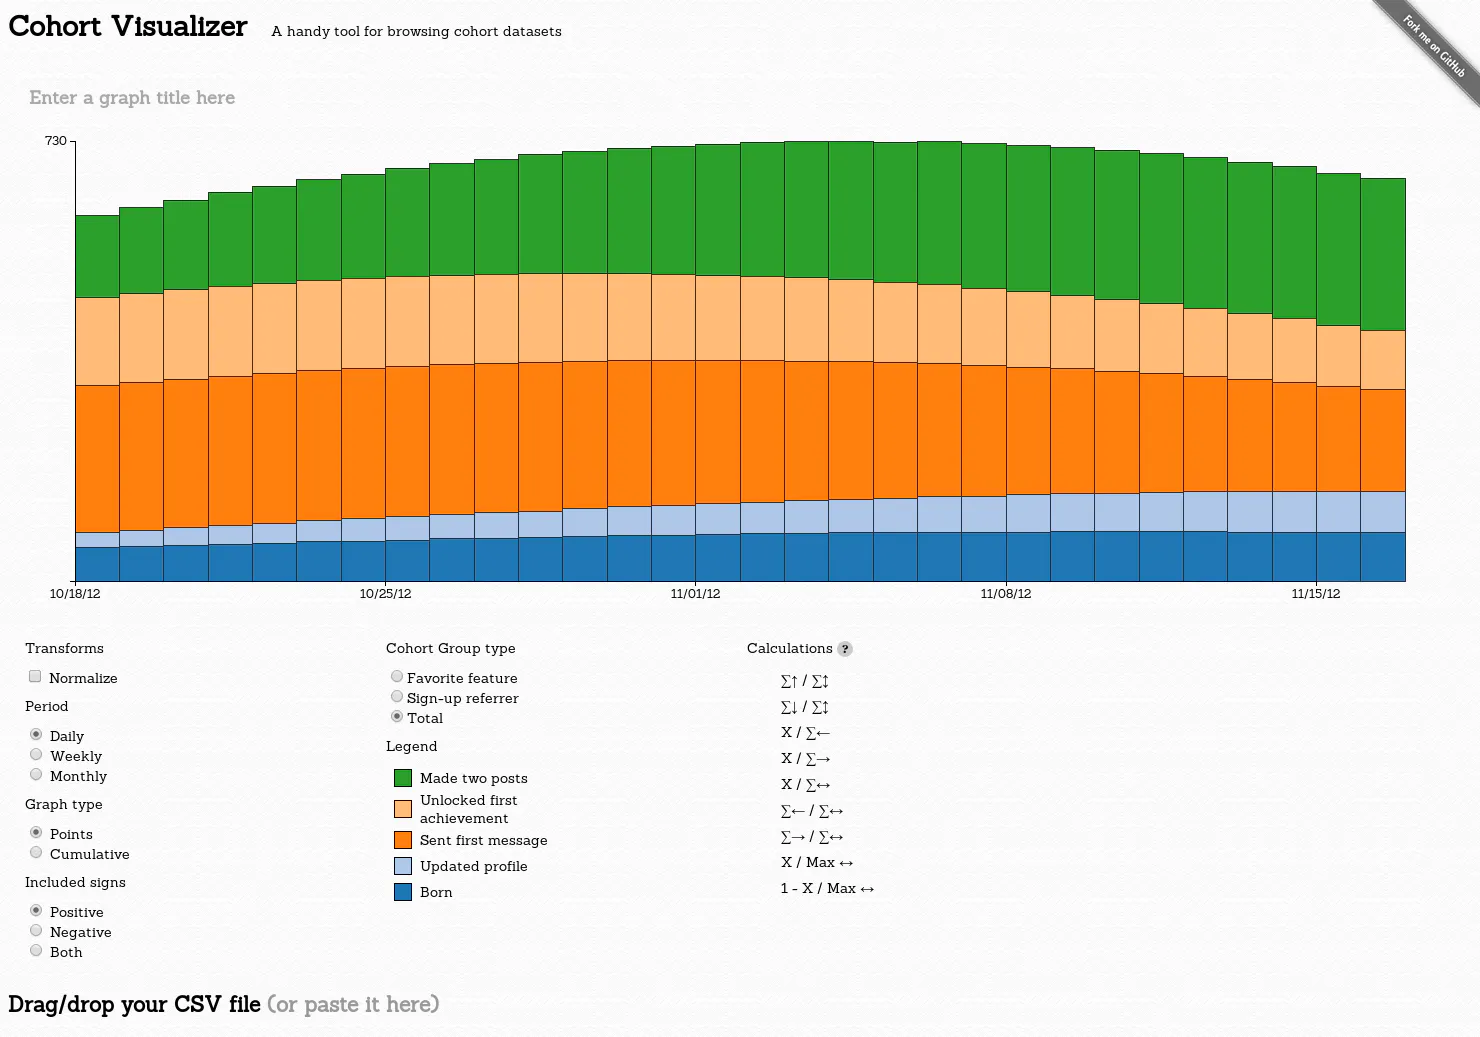
A handy tool for browsing cohort datasets
2014 · bslatkin.github.io · its alternatives →
- 18
 IssueVoter▲86
The election is over, now keep tabs on your rep
2016 · issuevoter.org · its alternatives →
- 19

Hi HN, I'm Jacek, the solo founder behind this project (Lustra). The Problem: 95% of legislation goes unnoticed because raw legal texts are unreadable. Media coverage is optimized for outrage, not insight. The Solution. I built a digital public infrastructure that: 1. Ingests & Sterilizes: Parses raw bills (PDF/XML) from US & PL APIs. Uses LLMs (Vertex AI, temp=0, strict JSON) to strip political spin. 2. Civic Algorithm: The main feed isn't sorted by an editorial board. It's sorted by user votes ("Shadow Parliament"). What the community cares about rises to the top. 3. Civic Projects:…
Dec 2025 · lustra.news · its alternatives →
- 20VM
Topological visualizations for the masses
2020 · topovis.iambeef.com · its alternatives →
- 21

- 22

- 23AS
2016 · snai.pe · its alternatives →
- 24ND
2014 · blog.spritesapp.com · its alternatives →
Also compare
- Voting Relationships in the US Senate alternatives
- Find members of Congress with similar voting records alternatives
- Tableau-Like Data Visualizations in JavaScript alternatives
- I built a dashboard of official data ahead of French elections alternatives
- Interactive map for architecting big data pipelines alternatives
- WebDataRocks Pivot Table alternatives
Ranked by how close each launch is in meaning, then by votes. Prices were read from each product’s own site when checked and can change. Refine with your own description →