Dev tools · alternatives · 2026

24 alternatives to roadway.report
Visualize USA Traffic Deaths 2001-2022
Below are 24 products that do a similar job, ranked by how close each is in meaning and then by launch-day votes. roadway.report launched in 2024; newer entries below may have overtaken it.
- 1MR
2013 · matthewisabel.com · its alternatives →
- 2
- 3DV
2017 · dvblogger.com · its alternatives →
- 4
 UberStats▲226
Visualize statistics on your years of Uber rides!
2018 · chromewebstore.google.com · its alternatives →
- 5
- 6

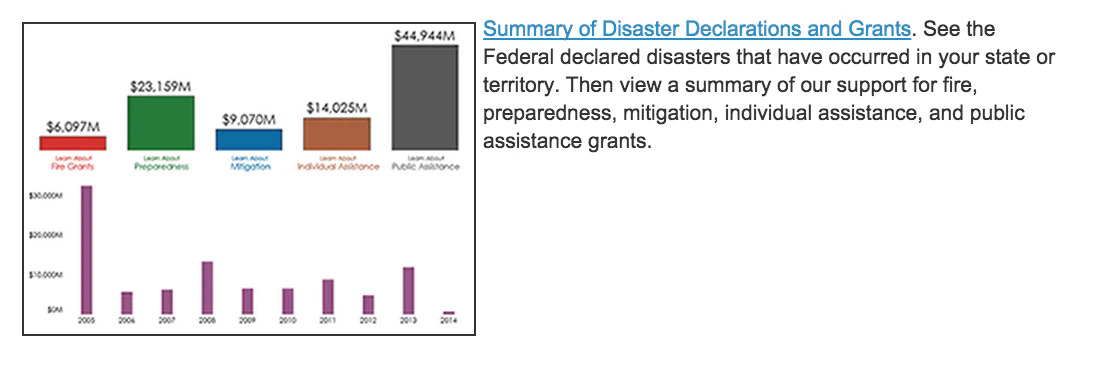
Live, interactive reports and dashboards for Google data
2016 · cloud.google.com · its alternatives →
- 7
 Open Census Data▲182
Visualize & download neighborhood demographic Insights
2018 · safegraph.com · its alternatives →
- 8

Beautifully visualize real-time search trends
2014 · trends.google.com · its alternatives →
- 9
- 10
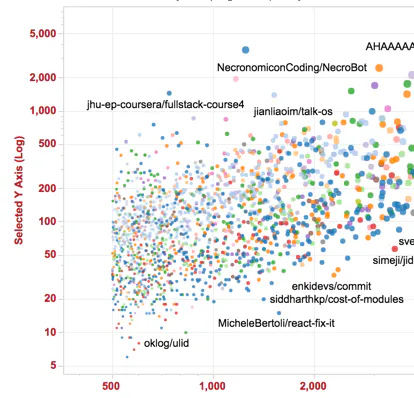
 Git analytics▲131
for software developers, teams, and open-source communities
2019 · its alternatives →
- 11

Real-time traffic reporting with proactive AI analysis
Oct 2025 · crazyegg.com · its alternatives →
- 12
 Data USA▲12
The most comprehensive visualization of U.S. public data
2016 · datausa.io · its alternatives →
- 13

I was developing/selling this application under Roadometry, but sales are getting slow and I'd prefer to make it available for free. This is a desktop Windows application which can be used for counting road traffic. https://roadometry.com https://www.youtube.com/@roadometry2011 The application uses Multiple Hypothesis Tracking (MHT) combined with Darknet Yolo. I trained the network myself. I have a tool-chain for building a video-based training set including associations, but it's quite complex to use. I never ended up training a network to perform association,…
2024 · github.com · its alternatives →
- 14

- 15
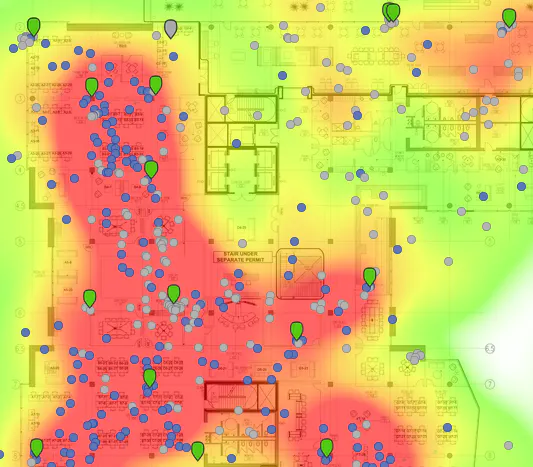
Visualizing your collected Google Location History data
2014 · theopolis.me · its alternatives →
- 16MF
I downloaded the MSHA's (Mine Safety and Health Administration) public datasets and create a visualization of all the mines in the US complete with the operators and details on each site.
Feb 2026 · mines.fyi · its alternatives →
- 17

- 18

- 19
 Slack Stats▲117
A weekly infographic report of your Slack stats
2016 · rocketgraph.com · its alternatives →
- 20
- 21

A map of deaths that occurred in NYC over the last 2 years
2015 · deathmapnyc.com · its alternatives →
- 22
 Statpedia▲125
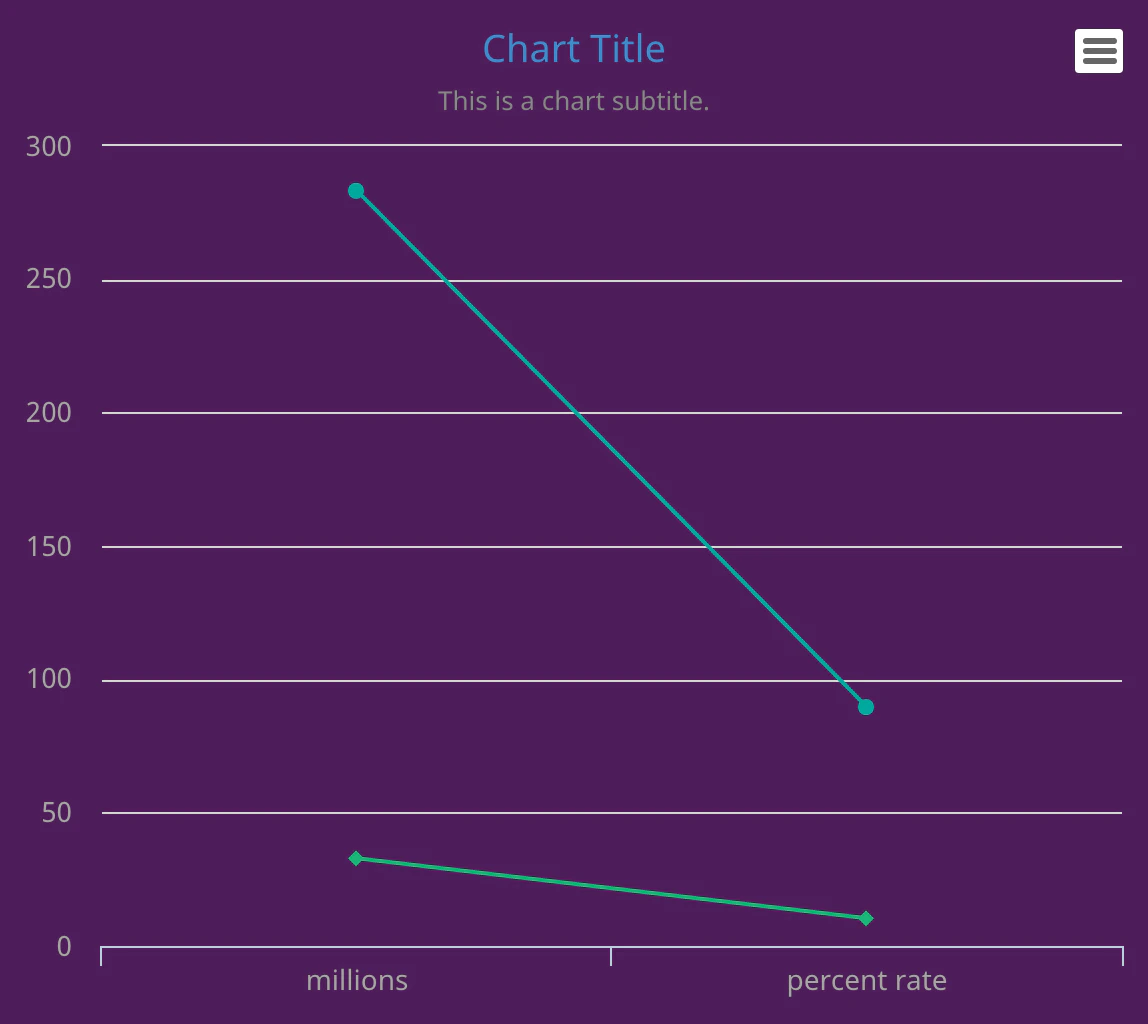
Simple chart creation tool, create one in seconds.
2016 · statpedia.com · its alternatives →
- 23

- 24

Roads? Where we're going ... we need better roads!
2016 · its alternatives →
Also compare
Ranked by how close each launch is in meaning, then by votes. Prices were read from each product’s own site when checked and can change. Refine with your own description →