Work · alternatives · 2026

24 alternatives to UberStats
Visualize statistics on your years of Uber rides!
Below are 24 products that do a similar job, ranked by how close each is in meaning and then by launch-day votes. UberStats launched in 2018; newer entries below may have overtaken it.
- 1
 Totals for Uber▲180
See how many miles you've traveled and hours spent in Uber
2015 · uber.totals.io · its alternatives →
- 2

- 3

- 4

- 5

- 6

- 7

- 8

Export, aggregate and visualize your Uber trip history
2016 · ummjackson.github.io · its alternatives →
- 9

- 10
 UberNeutral▲94
Offset carbon emissions for every Uber you’ve taken
2020 · uberneutral.com · its alternatives →
- 11

Real-time Fare Estimate Comparisons for Uber & Lyft
2014 · whatsthefare.com · its alternatives →
- 12

Each moving arrow represents one real bike ride out of 291 million, and if you've ever taken a Citi Bike before, you are included in this massive visualization! You can search for your ride using Cmd + K and your Citi Bike receipt, which should give you the time of your ride and start/end station. Everything is open source: https://github.com/freemanjiang/bikemap Some technical details: - No backend! Processed data is stored in parquet files on a Cloudflare CDN, and queried directly by DuckDB WASM - deck.gl w/ Mapbox for GPU-accelerated rendering of thousands of…
Jan 2026 · bikemap.nyc · its alternatives →
- 13

- 14
- 15

Each dot on the chart is a car. Horizontal scale = mileage. Vertical scale = price. The size of a dot = year (newer = larger), plus I colored 2007 .. 2011 in different colors to find "fresh" cars quicker. This is just some sample data from the last 24 hours, relatively cheap cars under $32,000 within 500 mile radius of NYC.
2011 · olegkikin.com · its alternatives →
- 16
 Travel Score▲82
Map the percentage you traveled in the world
2015 · travelscore.org · its alternatives →
- 17UP
2014 · jonsadka.github.io · its alternatives →
- 18
 Road Count▲145
Monitor and record traffic on your street with AI
2022 · roadcount.com · its alternatives →
- 19

- 20

From raw Uber data to explorable insights with one upload
2025 · app.vizzu.io · its alternatives →
- 21
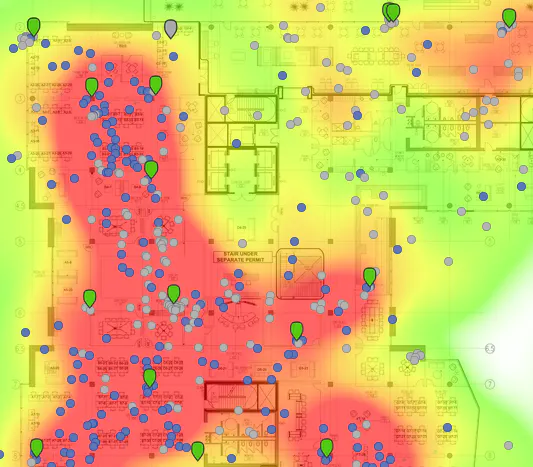
Visualizing your collected Google Location History data
2014 · theopolis.me · its alternatives →
- 22
 Uber Explore▲84
Browse and book dinner reservations, live events, and more
2022 · uber.com · its alternatives →
- 23
 Fuel Tracker▲75
Track fuel expenses for road trips and long drives!
2023 · play.google.com · its alternatives →
- 24

Also compare
Ranked by how close each launch is in meaning, then by votes. Prices were read from each product’s own site when checked and can change. Refine with your own description →