Commerce · alternatives · 2026
24 alternatives to Uber Pricing Data Visualized
Uber Pricing Data Visualized is an analytics tool that displays Uber pricing information through data visualization. Launched in 2014, the tool helps users understand Uber's pricing patterns and dynamics. It is… Below are 24 products that do a similar job, ranked by how close each is in meaning and then by launch-day votes. Prices are shown for the 1 we have checked on their own sites, 1 of them free or with a free tier. Uber Pricing Data Visualized launched in 2014; newer entries below may have overtaken it.
- 1

- 2

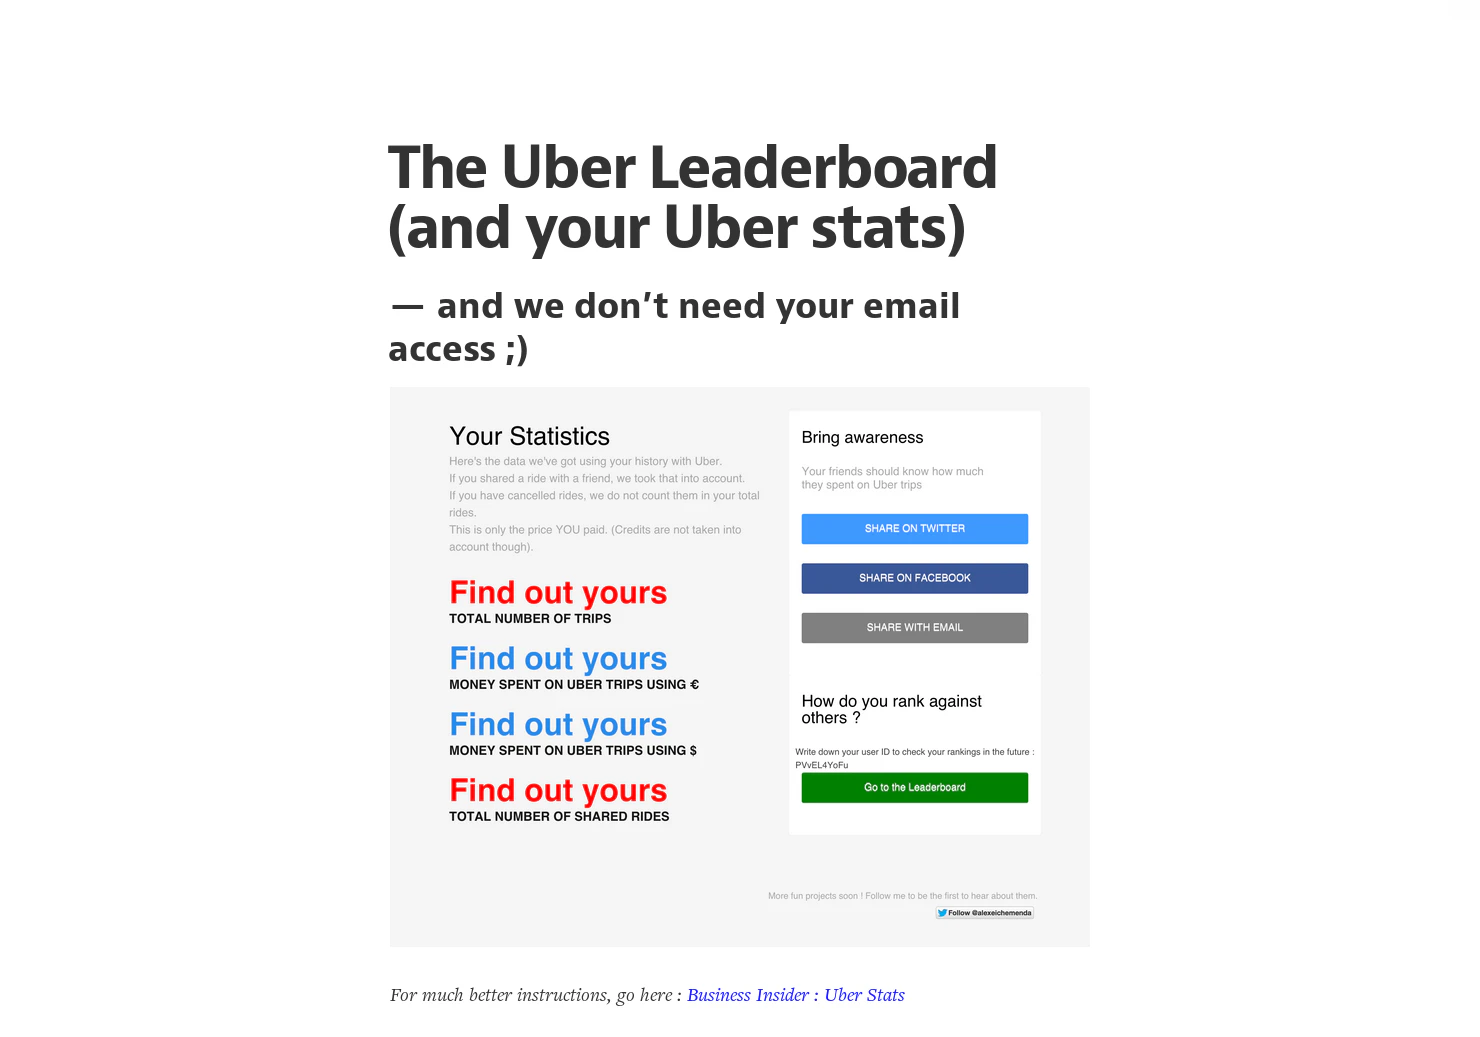
Export, aggregate and visualize your Uber trip history
2016 · ummjackson.github.io · its alternatives →
- 3
 UberStats▲226
Visualize statistics on your years of Uber rides!
2018 · chromewebstore.google.com · its alternatives →
- 4

- 5
 ChartGen AI▲489
Hi HN, I’m the maker of ChartGen AI. Last year, we launched a text-based AI agent called Ada.im. After analyzing thousands of user interactions, we stumbled upon a pattern we hadn't expected: users were constantly trying to paste data rows and ask for visual representations, but the text-based model couldn't handle it well. We realized that for marketers, seeing the trend is more valuable than reading about it. We pivoted that insight into a standalone tool: Drag & Drop: Upload raw CSVs (FB Ads, GA4, TikTok, etc.). Processing: We map the disparate column names into a unified schema. Viz: It…
Jan 2026 · chartgen.ai · its alternatives →
- 6
 ADS-B visualizer▲339
I've created a web app for querying and visualization of ADS-B datasets: https://adsb.exposed/ Source code: https://github.com/ClickHouse/adsb.exposed/ The results significantly exceeded my expectations because the pictures are insanely beautiful, and the data is a treasure trove. It proves many statements that were not certain: - it is feasible to generate tiles by aggregation on a pixel level (instead of hexagons or rectangular grid); - it does not require JPG/PNG tiles - we can transfer raw bitmap data with zstd compression; - it is possible to…
2024 · adsb.exposed · its alternatives →
- 7

- 8

Where to? See upfront fares & estimated arrival times
2016 · uber.com · its alternatives →
- 9
- 10

From raw Uber data to explorable insights with one upload
2025 · app.vizzu.io · its alternatives →
- 11
 Totals for Uber▲180
See how many miles you've traveled and hours spent in Uber
2015 · uber.totals.io · its alternatives →
- 12

Creating data visualizations with AI nowadays often means chat, chat and more chats...and writing long prompts can be annoying while they are also not the most effective way to describe your visualization designs. Data Formulator blends UI interaction with natural language so that you can create visualizations with AI much more effectively! You can: * create rich visualizations beyond initial datasets, where AI helps transforming and visualizing data along the way * iterate your designs and dive deeper using data threads, a new way to manage your conversation with AI. Here is a demo video:…
2024 · github.com · its alternatives →
- 13

- 14

Write down your algorithm to be visualized
2016 · jasonpark.me · its alternatives →
- 15

- 16
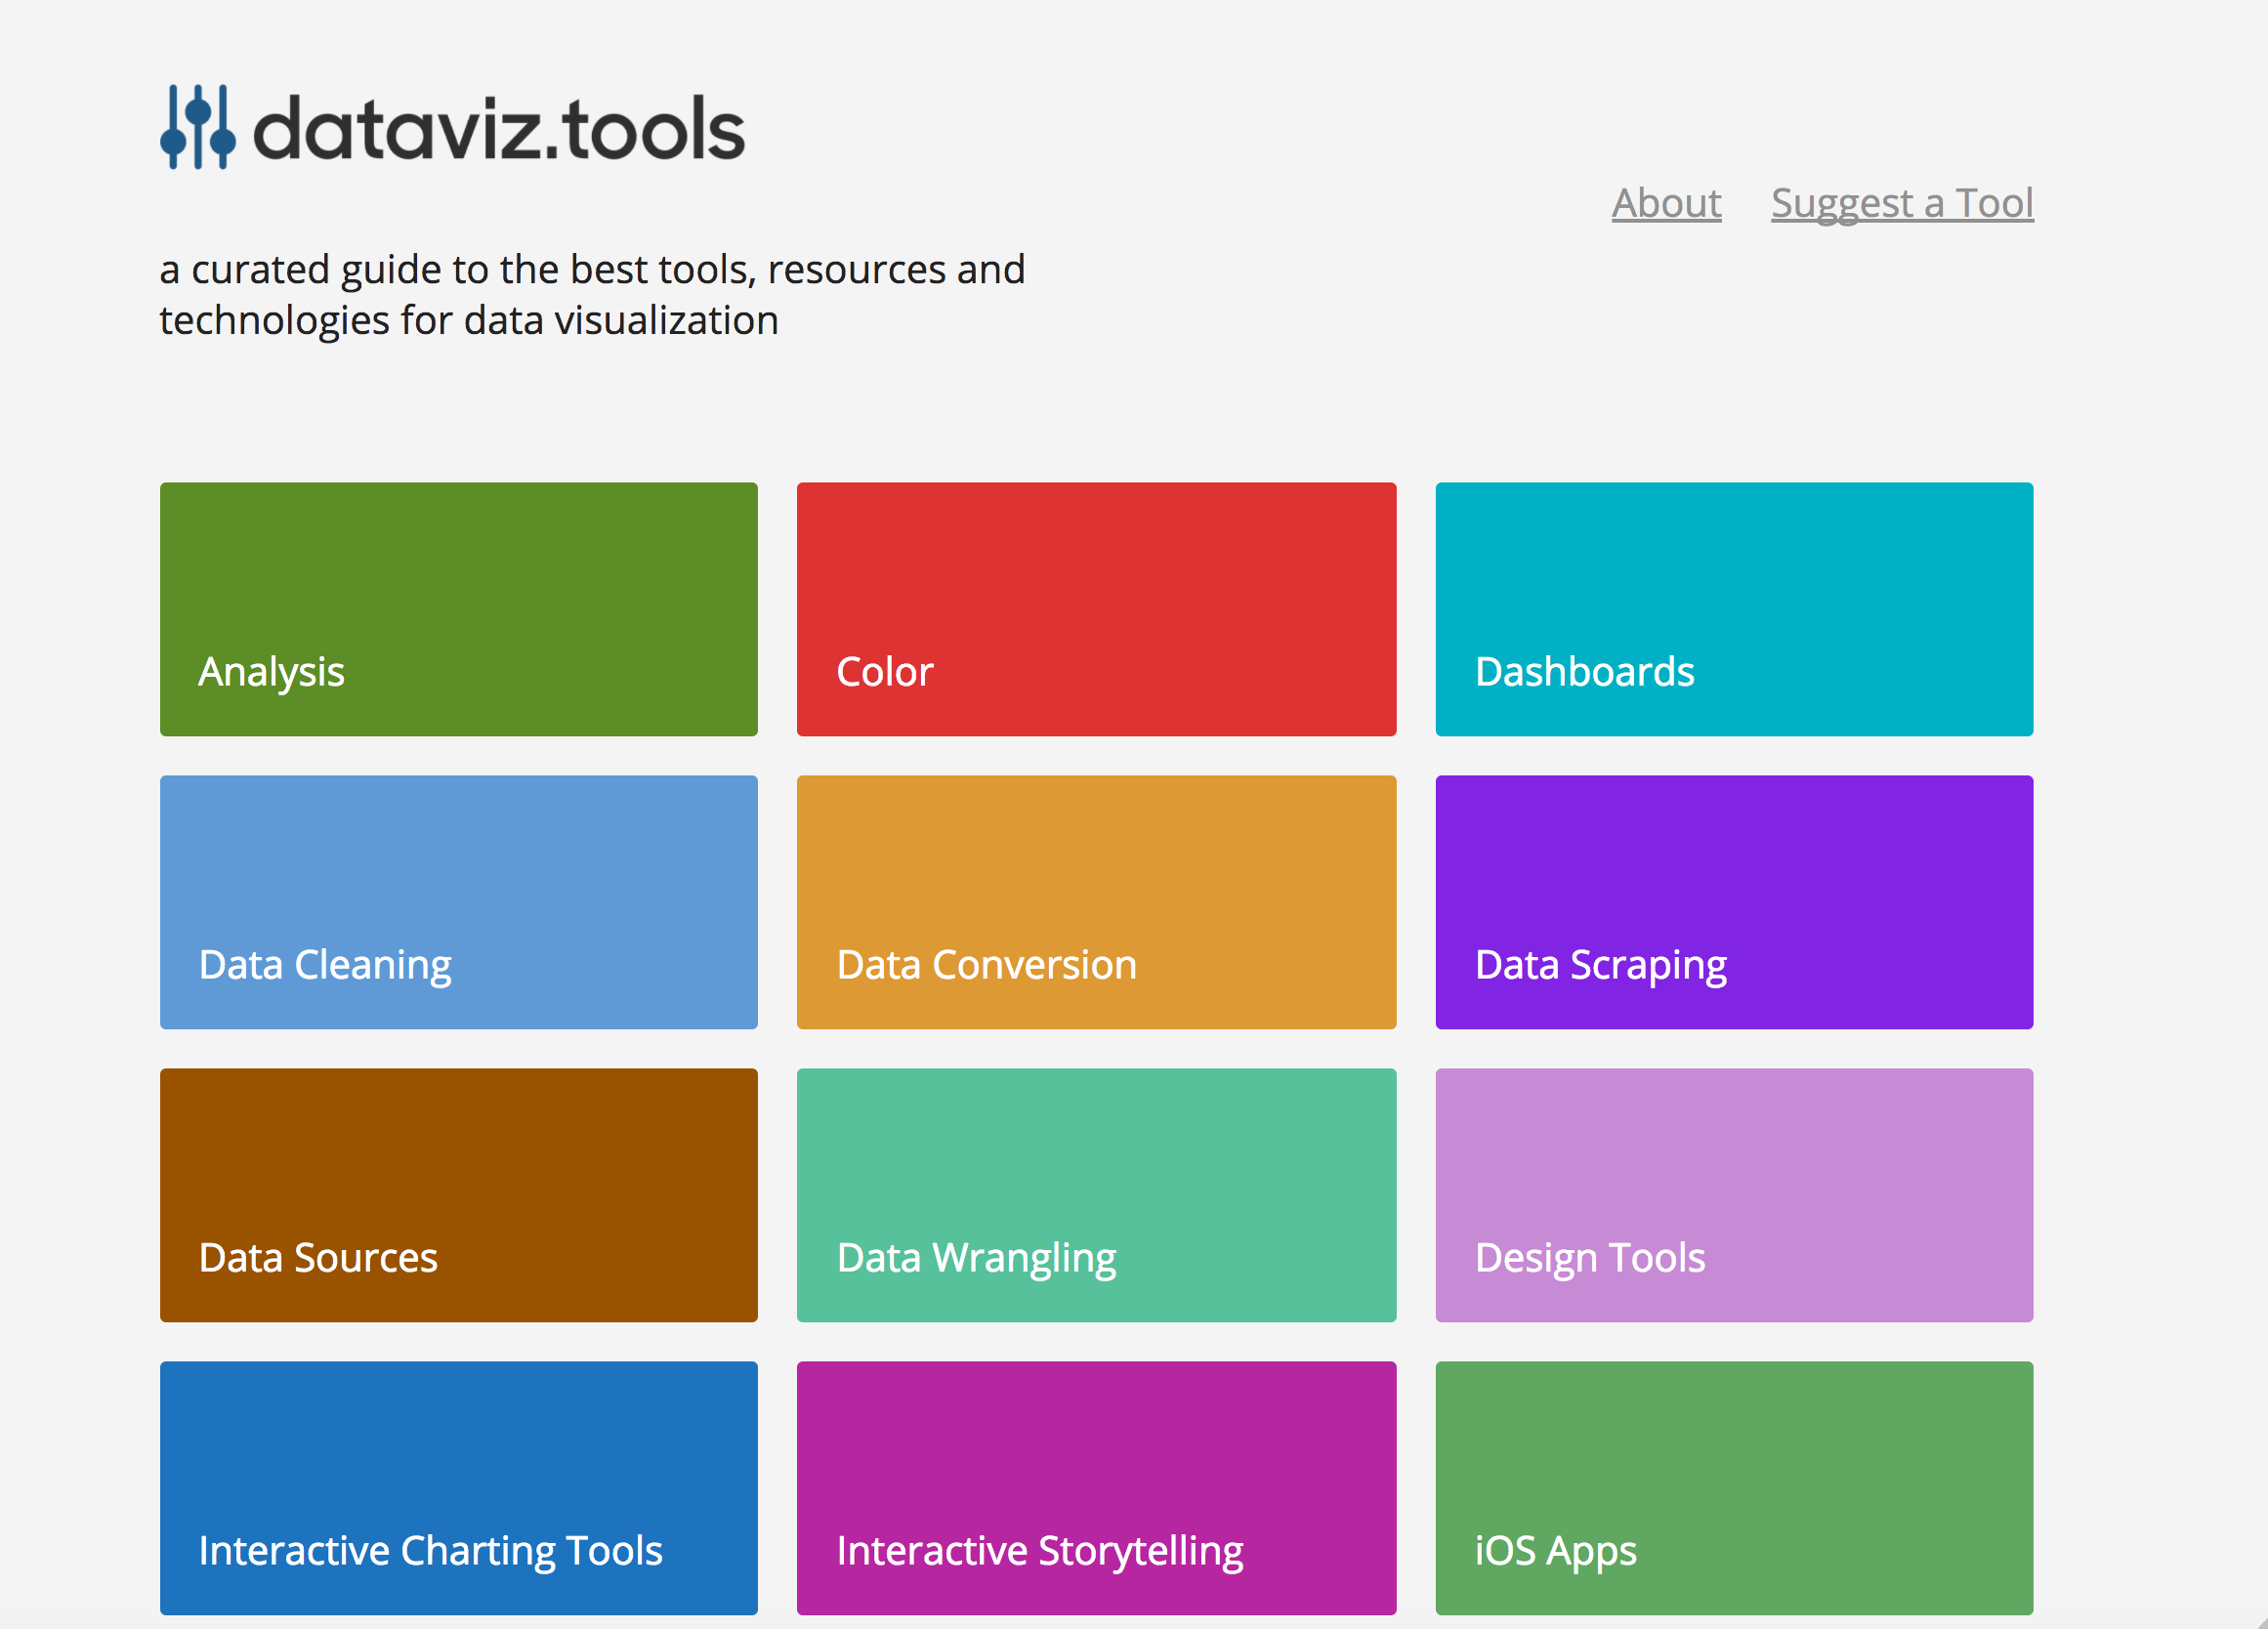 dataviz.tools▲409
Curated collection of the 400 best data visualization tools
2017 · dataviz.tools · its alternatives →
- 17

Understand your customers’ buying behaviour inside HubSpot
2021 · ecosystem.hubspot.com · its alternatives →
- 18US
2014 · uphail.com · its alternatives →
- 19
- 20
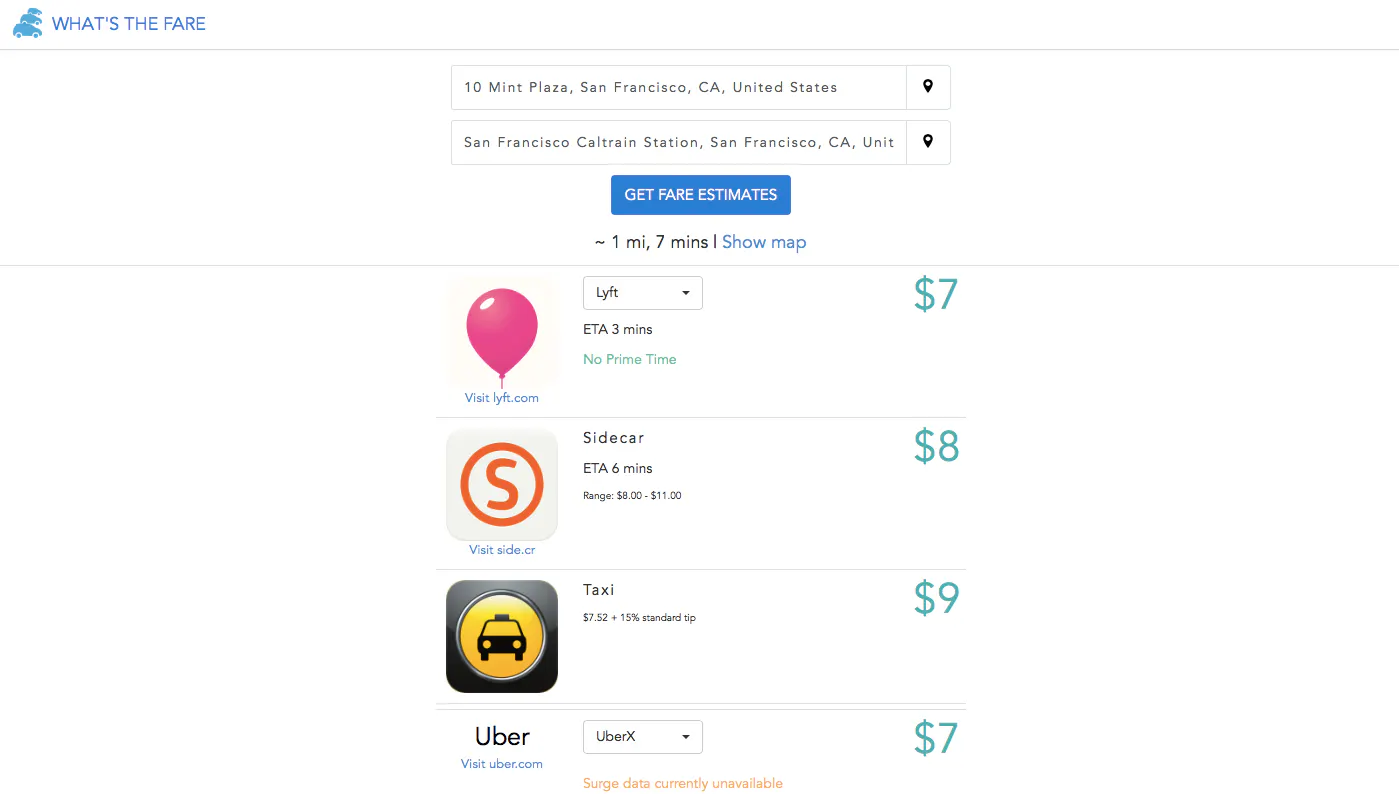
Real-time Fare Estimate Comparisons for Uber & Lyft
2014 · whatsthefare.com · its alternatives →
- 21

- 22
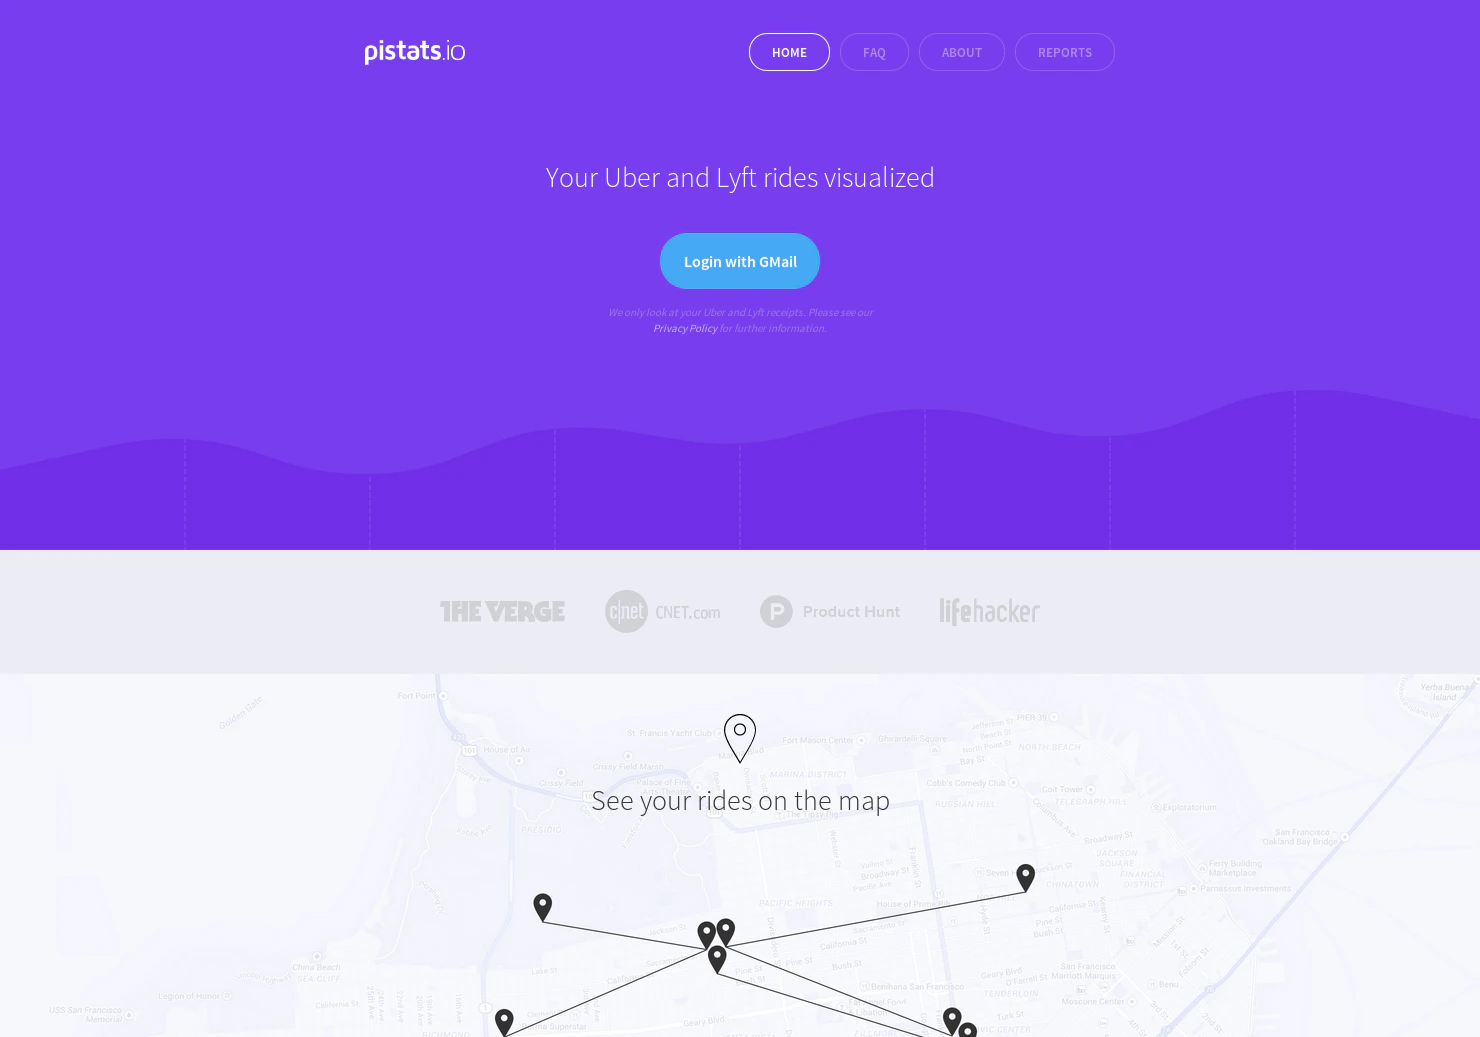
- 23
- 24
 kepler.gl▲116
Uber's geospatial analysis tool for large-scale data sets
2018 · kepler.gl · its alternatives →
Also compare
Ranked by how close each launch is in meaning, then by votes. Prices were read from each product’s own site when checked and can change. Refine with your own description →