Dev tools · alternatives · 2026

24 alternatives to Excalichart
Cut through the noise.
Below are 24 products that do a similar job, ranked by how close each is in meaning and then by launch-day votes. Excalichart launched in 2023; newer entries below may have overtaken it.
- 1

Excalichart is an open source BI tool for finding insights in your data. - excalichart/excalichart
2023 · github.com · its alternatives →
- 2

Add sketches to all your docs, wiki, notes and projects
2021 · slite.com · its alternatives →
- 3
 Glazed▲867
Turn Figma files into production-ready tracking in minutes
2024 · glazedanalytics.com · its alternatives →
- 4

Excalideck is an app for authoring slide decks that look hand-drawn.
2021 · excalideck.com · its alternatives →
- 5

- 6

- 7
 OOcharts▲81
A toolkit for building your own Google Analytics dashboard.
2014 · oocharts.com · its alternatives →
- 8

- 9

- 10
 Exstats▲225
Track your browser extensions and competitors in one place
May 2026 · exstats.com · its alternatives →
- 11

Monitor your key metrics, everywhere you go
2016 · apps.apple.com · its alternatives →
- 12

Virtual whiteboard for sketching hand-drawn like diagrams - excalidraw/excalidraw
2020 · github.com · its alternatives →
- 13

- 14
 Vizzu▲225
Open-source JS library to build animated charts with ease
2022 · vizzu.io · its alternatives →
- 15

Hello, guys~ I recently developed a data exploration and visualization app which can be used as a different type of open-source alternative to Tableau. It is extremely easy to embed in your apps just as a react component. The original purpose is to develop a lite plugin that can be easily embedded in most cases, it doesn't have to be a large BI, but a lite graphic plugin. GitHub: Kanaries/graphic-walker, https://github.com/Kanaries/graphic-walker The main features implemented: * A user-friendly drag-and-drop-based interaction for exploratory data analysis with…
2023 · github.com · its alternatives →
- 16
 ROAARRR▲182
Hey HN, I built ROAARRR because most analytics tools make it hard to get clear answers. You spend hours setting up dashboards and connecting data, but you still don’t really know what drives growth. ROAARRR brings your key data together and shows your funnel from awareness to revenue. You can track product activity, create charts for specific events, and see how changes affect retention and revenue. It’s free to try today. I’d love your feedback, especially on what feels confusing or missing.
Nov 2025 · roaarrr.app · its alternatives →
- 17
- 18
 Excalidraw▲103
Virtual whiteboard for sketching hand-drawn like diagrams
2020 · excalidraw.com · its alternatives →
- 19

- 20

Hand-draw style diagrams, save to the cloud — for free.
Oct 2025 · excalidraw.cn · its alternatives →
- 21

An easy way to build analytics dashboards and applications
2019 · cube.dev · its alternatives →
- 22

- 23
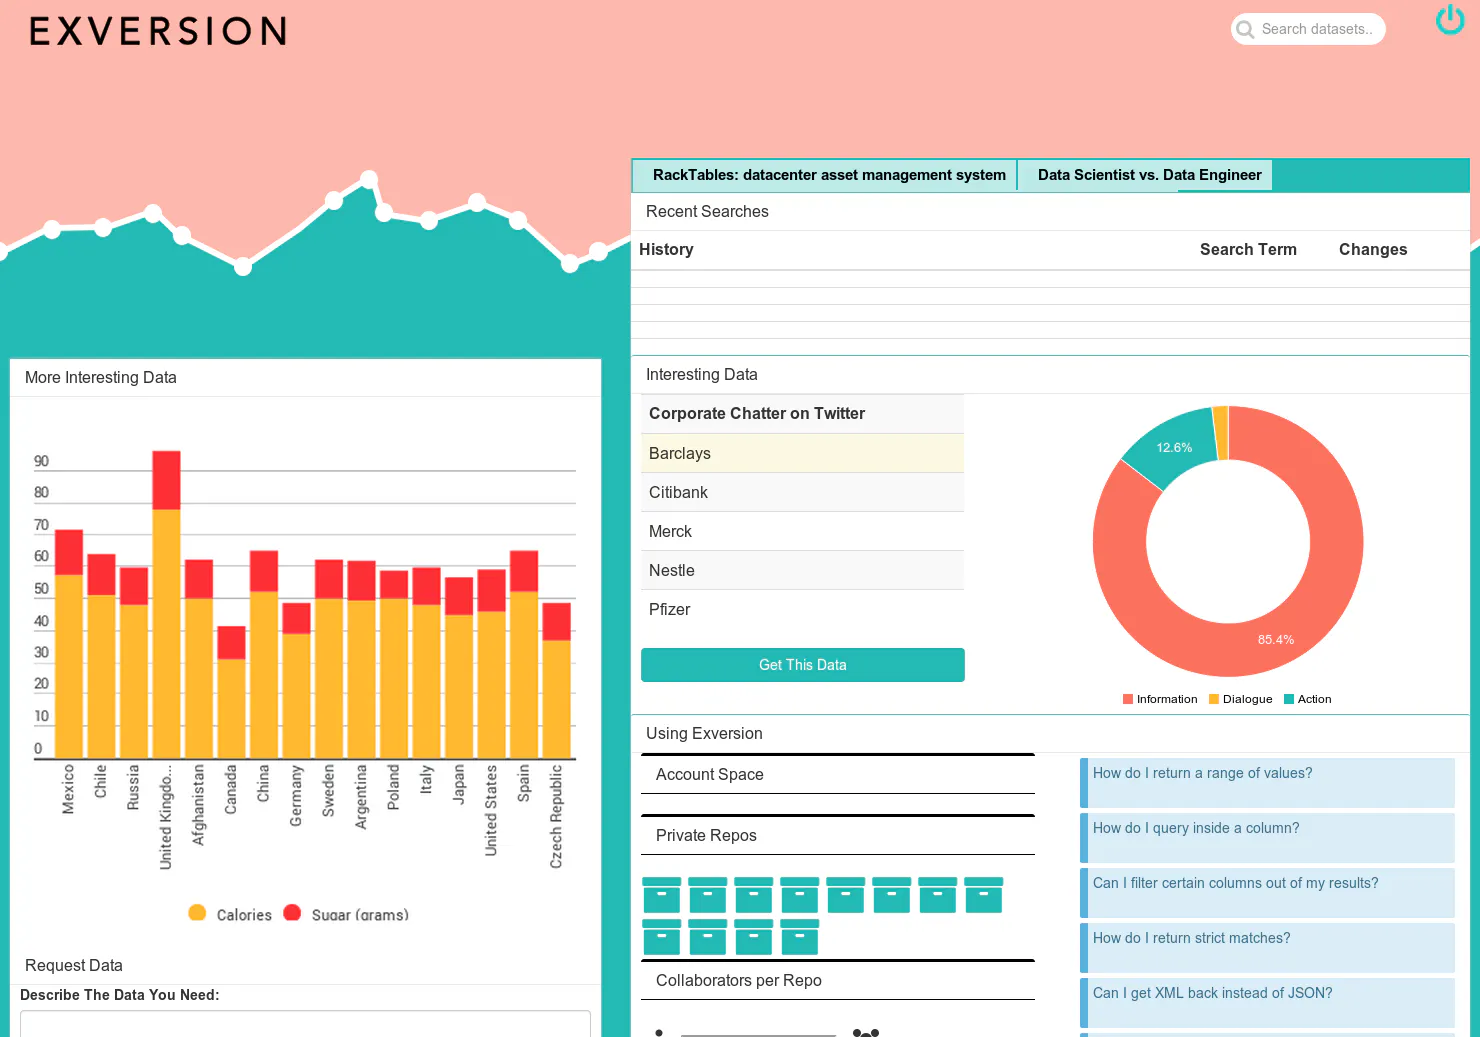 Exversion▲82
Free tool to easily collaborate with your team on data.
2014 · exversion.com · its alternatives →
- 24

API for beautiful interactive graphics from time-series data
2014 · metricsgraphicsjs.org · its alternatives →
Also compare
Ranked by how close each launch is in meaning, then by votes. Prices were read from each product’s own site when checked and can change. Refine with your own description →