Dev tools · alternatives · 2026

24 alternatives to Flexible command line tool to create graphs from CSV data
Flexible command line tool to create graphs from CSV data - mcastorina/graph-cli
This tool allows users to generate graphs directly from CSV data through a command-line interface. It was designed for people who need to visualize tabular data without complex setup or graphical tools. The software is… Below are 24 products that do a similar job, ranked by how close each is in meaning and then by launch-day votes. Flexible command line tool to create graphs from CSV data launched in 2018; newer entries below may have overtaken it.
- 1

Make bar charts on the terminal. Contribute to TurkeyMcMac/barchart development by creating an account on GitHub.
2021 · github.com · its alternatives →
- 2DE
2012 · datafart.com · its alternatives →
- 3GA
2019 · tailgraph.live · its alternatives →
- 4
 mdi-cli▲92
Generate material design icons from the command line
2018 · github.com · its alternatives →
- 5

- 6
 GitHub CLI▲408
GitHub’s official free and open source command line tool
2020 · cli.github.com · its alternatives →
- 7

🧜♀️ RESTful rendering pipeline for generating sequence and UML diagrams using Mermaid for Markdown docs (Diagrams as a Service) - Schachte/Mermrender
2019 · github.com · its alternatives →
- 8
 Hubql CLI▲119
Create data schema visualizations from your terminal
2024 · schemavisualizer.dev · its alternatives →
- 9

I built a Rust-based CLI/terminal UI for inspecting Parquet files—data, metadata, and row-group-level structure—right from the terminal. If someone sent me a Parquet file, I used to open DuckDB or Polars just to see what was inside. Now I can do it with one command. Repo: https://github.com/kaushiksrini/parqeye
Nov 2025 · github.com · its alternatives →
- 10
- 11

I do lots of data analyses in the command-line and I was missing a simple utility to plot the output of a command (without having to script it). I like very much the Matplotlib API but I found no CLI to pipe data into it. So, I wrote MatplotCLI, a simple CLI that reads data from the stdin and allows to easily create interactive plots from the command-line. Have a look at the README for examples and recipes. Let me know what you think, thanks! Some examples: $ plt "hist(x,30)" < sample.json $ cat sample.json | plt --no-show "hist(x,30); savefig('myimage.png')" $ plt --no-input " x =…
2022 · github.com · its alternatives →
- 12

I was constantly googling CLI commands so I built this small CLI tool with GPT3. You can ask for shell commands right from the CLI. You'd need to use your own API KEY for this but it's pretty simple, instructions are in the README Not perfect but not bad either.
2022 · github.com · its alternatives →
- 13

A native command-line interface for working with Apple Core ML models on macOS - schappim/coreml-cli
Jan 2026 · github.com · its alternatives →
- 14

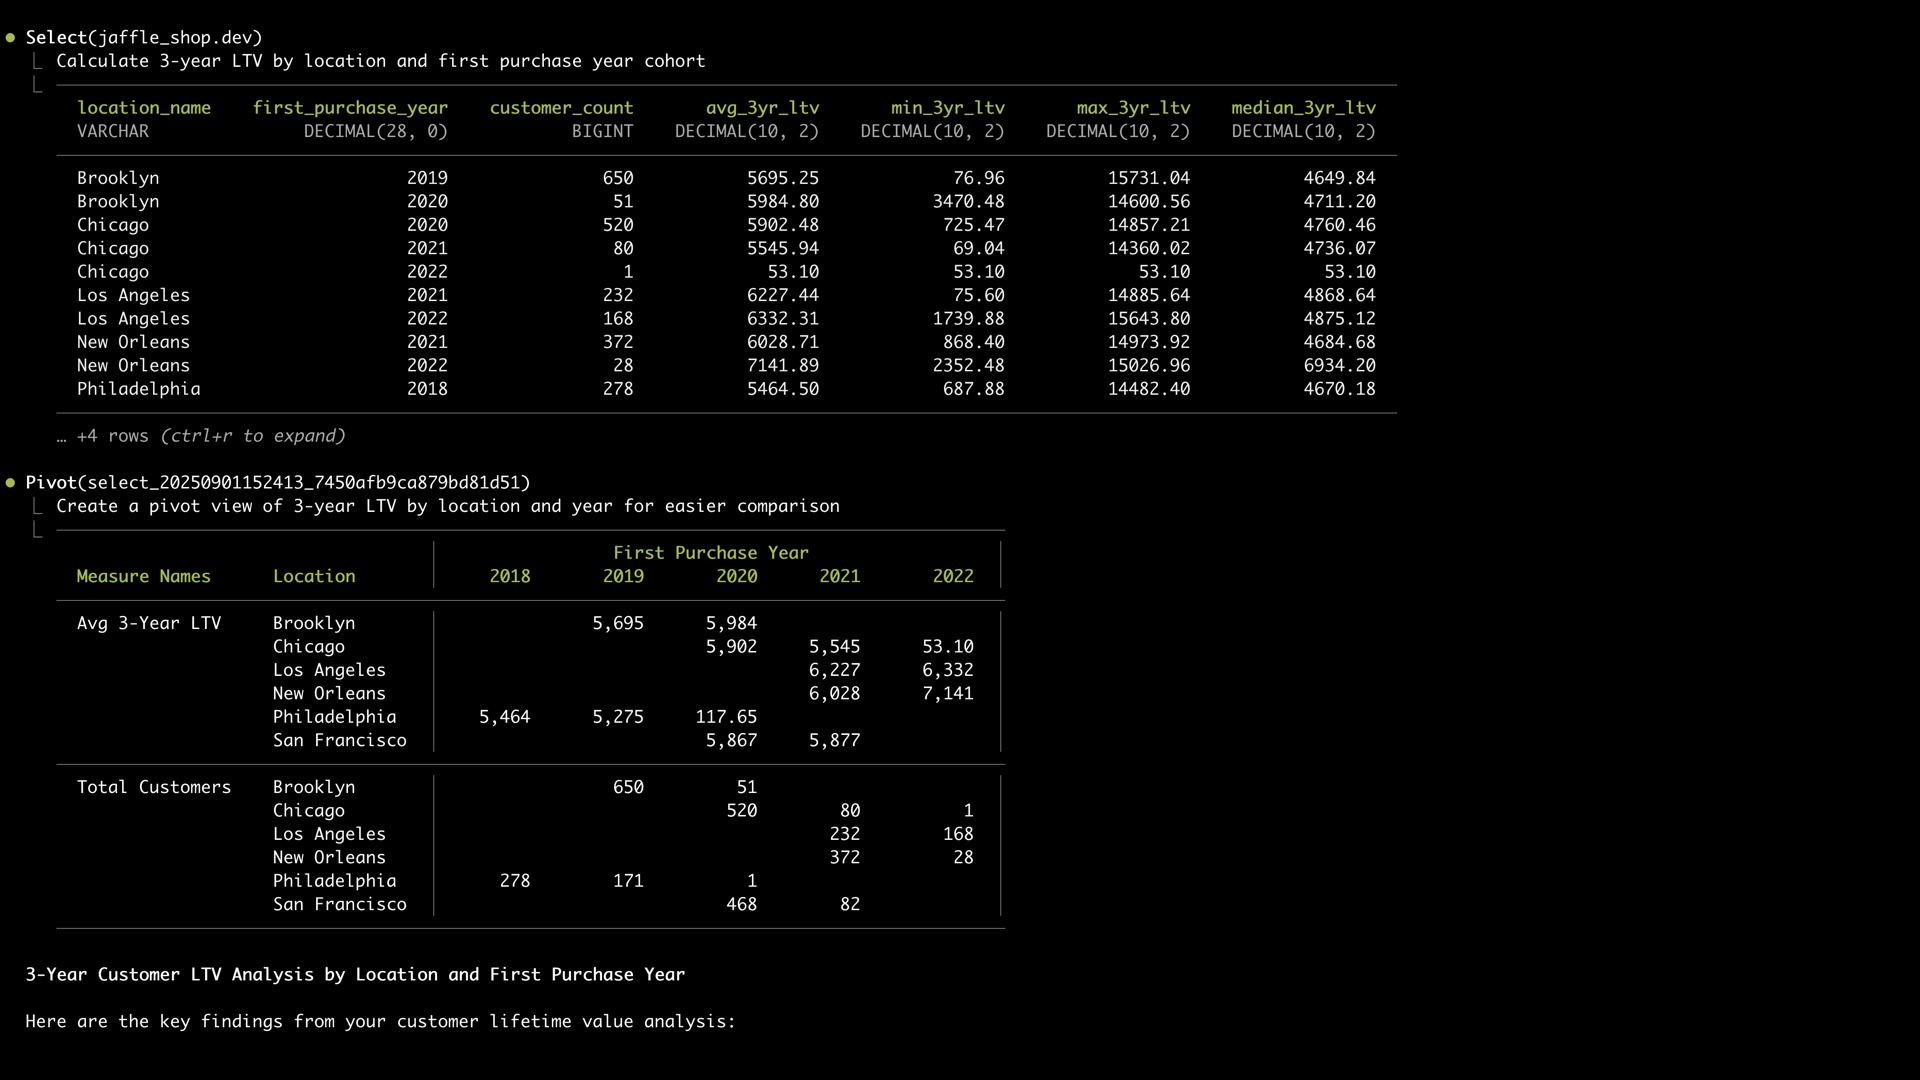
Hi HN, I built Datacmd to eliminate bloated dashboards and browser UIs. It turns any CSV, JSON, API feed into live, terminal-native dashboards with one command. Fast. Minimal. Developer-centric. AND IT'S OPEN SOURCE https://github.com/VincenzoManto/datacmd What it does: * Generates dynamic dashboards in the terminal: tables, gauges, pie charts, line charts, radars, text boxes * Layout auto-generated or configurable via YAML * Supports CSV, JSON, REST APIs, live system metrics (CPU, memory, disk) Why this matters: * No GUI. Instant visuals where developers live * Zero…
2025 · github.com · its alternatives →
- 15

I've always thought that extensive reading was best suited for the realm of paper. As a result, I've created a command-line interface (CLI) tailored for my own use and decided to make it open source. I welcome any feedback you may have. [Edit] Sample PDF :: https://drive.google.com/file/d/1n7M1TKOptSsYiibrbvV_Yojx53T...
2024 · github.com · its alternatives →
- 16

Query CSVs using SQL. Contribute to jolmg/cq development by creating an account on GitHub.
2019 · github.com · its alternatives →
- 17CU
2012 · chartulo.us · its alternatives →
- 18

simple statistics from the command line. Contribute to nferraz/st development by creating an account on GitHub.
2013 · github.com · its alternatives →
- 19
- 20

A graph based REPL that saves to and loads from disk - incrediblesound/Graph-Reply
2015 · github.com · its alternatives →
- 21

This program provides a simple way of visualizing the different regions of a binary file. Written in C, depends only on libpng. Currently (commit 1dd42e3) it is able to generate PNG images that represent various aspects of the binary: - Grayscale: Byte values, 00..FF. - Ascii: Printability of each byte. - Entropy: Of a "block", changed with --block-size. - Histogram: Bar graph of the byte frequencies. - Bigrams: Each point is determined by a pair of bytes. - Dotplot: Measure self-similarity. Image width/height is N^2. In the future, I plan on adding an SDL version that allows the user…
2024 · github.com · its alternatives →
- 22
 Tufte▲87
CDN and Node package to generate ASCII graphs inline
Jun 2026 · tufte.ai · its alternatives →
- 23

Last month, I started learning a Python TUI framework called Textual. After working on a 4x4 board game, I made an interactive app to test your CLI text processing skills with 40 beginner to intermediate level exercises. The app is fairly basic in terms of features — only single input file, so no stdin data, multiple files, etc. Most of the exercises in this app is based on my Computing from the Command Line ebook (https://learnbyexample.github.io/cli-computing/preface.html). I hope to improve the TUI app to support all the 200+ exercises sometime next year.
2022 · github.com · its alternatives →
- 24

Also compare
Ranked by how close each launch is in meaning, then by votes. Prices were read from each product’s own site when checked and can change. Refine with your own description →