Life & fun · alternatives · 2026

24 alternatives to Free GeoJSON editor to visualize, download or convert into many formats
Revolutionize GIS data management with Geoman for Leaflet, MapLibre, and Mapbox. Add drawing, editing, cutting, splitting, snapping, measuring, and more directly on the map.
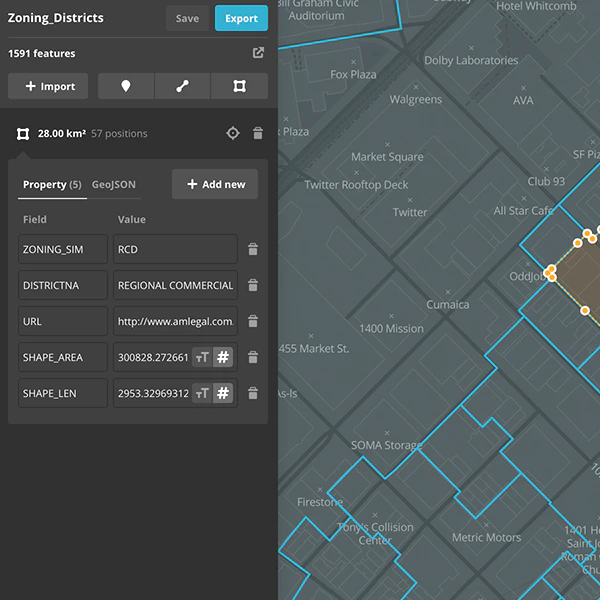
GeoJSON Editor is a web tool for working with geographic data. It allows users to visualize GeoJSON files, edit map features, and convert data into multiple formats. The tool is designed for developers, cartographers… Below are 24 products that do a similar job, ranked by how close each is in meaning and then by launch-day votes. Free GeoJSON editor to visualize, download or convert into many formats launched in 2020; newer entries below may have overtaken it.
- 1
Creating and edit geospatial data in your browser
2016 · mapbox.com · its alternatives →
- 2

- 3

A simple mapping tool right in your browser
2025 · chromewebstore.google.com · its alternatives →
- 4

MapHub allows you to create, share and collaborate interactive maps online.
2016 · maphub.net · its alternatives →
- 5

- 6

Globe wireframe visualizations in Golang. Contribute to mmcloughlin/globe development by creating an account on GitHub.
2017 · github.com · its alternatives →
- 7
 TravelAnimator▲536
Turn Google Maps URLs into stunning map animations.
Jan 2026 · travelanimator.com · its alternatives →
- 8

3D geographic visualization library. Contribute to w3reality/three-geo development by creating an account on GitHub.
2018 · github.com · its alternatives →
- 9

Design beautiful map interfaces with Google Maps & Mapbox
2017 · codeload.github.com · its alternatives →
- 10

Hi all! TikZ is a widely-used LaTeX package for drawing figures in papers. It uses commands like \draw[->] (0,0) -- (1,2); to draw lines, shapes, text, etc. Academics usually code up their figures by hand, so there is lots of twiddling around with the coordinates and recompiling until things look nice. I guess it’s a bit like SVG, but it’s more code than markup, for example it has loops with \foreach. I built an open-source WYSIWYG TikZ editor (available for web and desktop) that allows you to edit your TikZ source code visually by dragging and resizing elements. It simultaneously shows the…
Jun 2026 · tikz.dev · its alternatives →
- 11
 Gio.js▲77
3D globe info visualization library built with Three.js
2018 · github.com · its alternatives →
- 12

Online WYSIWYG Mathematics Editor (Equation Editor), fast and powerful Editing features, inputting Normal text, Math symbols, and drawing Graph/Diagram in one single editor, help writing Math Document much easier. Export to Latex, Tikz, SVG, or Image (PNG).
2017 · mathcha.io · its alternatives →
- 13

Effortless JSON Editing, Anywhere!
2023 · chromewebstore.google.com · its alternatives →
- 14
 Quetzly▲79
Test, monitor, and visualize your location APIs in one place
Jan 2026 · quetzly.com · its alternatives →
- 15

Flexible tool to build planet-scale vector tilesets from OpenStreetMap data fast - onthegomap/planetiler
2021 · github.com · its alternatives →
- 16

map33.js is a JavaScript library to build 3D maps. Made by Openbloc with three.js.
2020 · map33.openbloc.com · its alternatives →
- 17
 Mapbox GLJS V2▲116
Interactive, customizable 3D maps in your browser
2020 · mapbox.com · its alternatives →
- 18KM
2024 · krata.app · its alternatives →
- 19
 GraphQL Editor▲156
Online GraphQL IDE, visualize your GraphQL Schema
2019 · graphqleditor.com · its alternatives →
- 20G3
I made a web app to generate 3D models of real places on earth from land cover and elevation data. Click anywhere on the map to get a polygon, and then click "generate". It should work at most scales, but if your watershed or region selection is too large, the result can be less exciting because it's so flat. As a warning, the 3D models can sometimes be too much for my phone. It's nicer on desktop. I'm still working better on mobile support. The land cover data I'm using gives a cool effect, but at some point I'd like to add in global imagery and clouds. The backend is a Python thread…
2025 · topography.jessekv.com · its alternatives →
- 21

🌏 A Declarative 3D Globe Data Visualization Library built with Three.js - syt123450/giojs
2018 · github.com · its alternatives →
- 22GI
2016 · geoparser.io · its alternatives →
- 23
 Figma Map Maker▲162
Figma plugin to generate map, supporting Google Maps, Mapbox
2019 · figma.com · its alternatives →
- 24
 GeoPreview▲70
Preview GIS files directly in Finder (GeoJSON, SHP, GPKG)
Apr 2026 · apps.apple.com · its alternatives →
Also compare
Ranked by how close each launch is in meaning, then by votes. Prices were read from each product’s own site when checked and can change. Refine with your own description →