Dev tools · alternatives · 2026
24 alternatives to Google Globe Trends
Create beautiful Google Trends globe visualizations
Below are 24 products that do a similar job, ranked by how close each is in meaning and then by launch-day votes. Google Globe Trends launched in 2019; newer entries below may have overtaken it.
- 1
 Google Trends▲700
A new experience to explore what the world is searching 🔎📈📊
2018 · trends.google.com · its alternatives →
- 2

The easiest way for data people to track internet trends
2020 · egp88original.com · its alternatives →
- 3
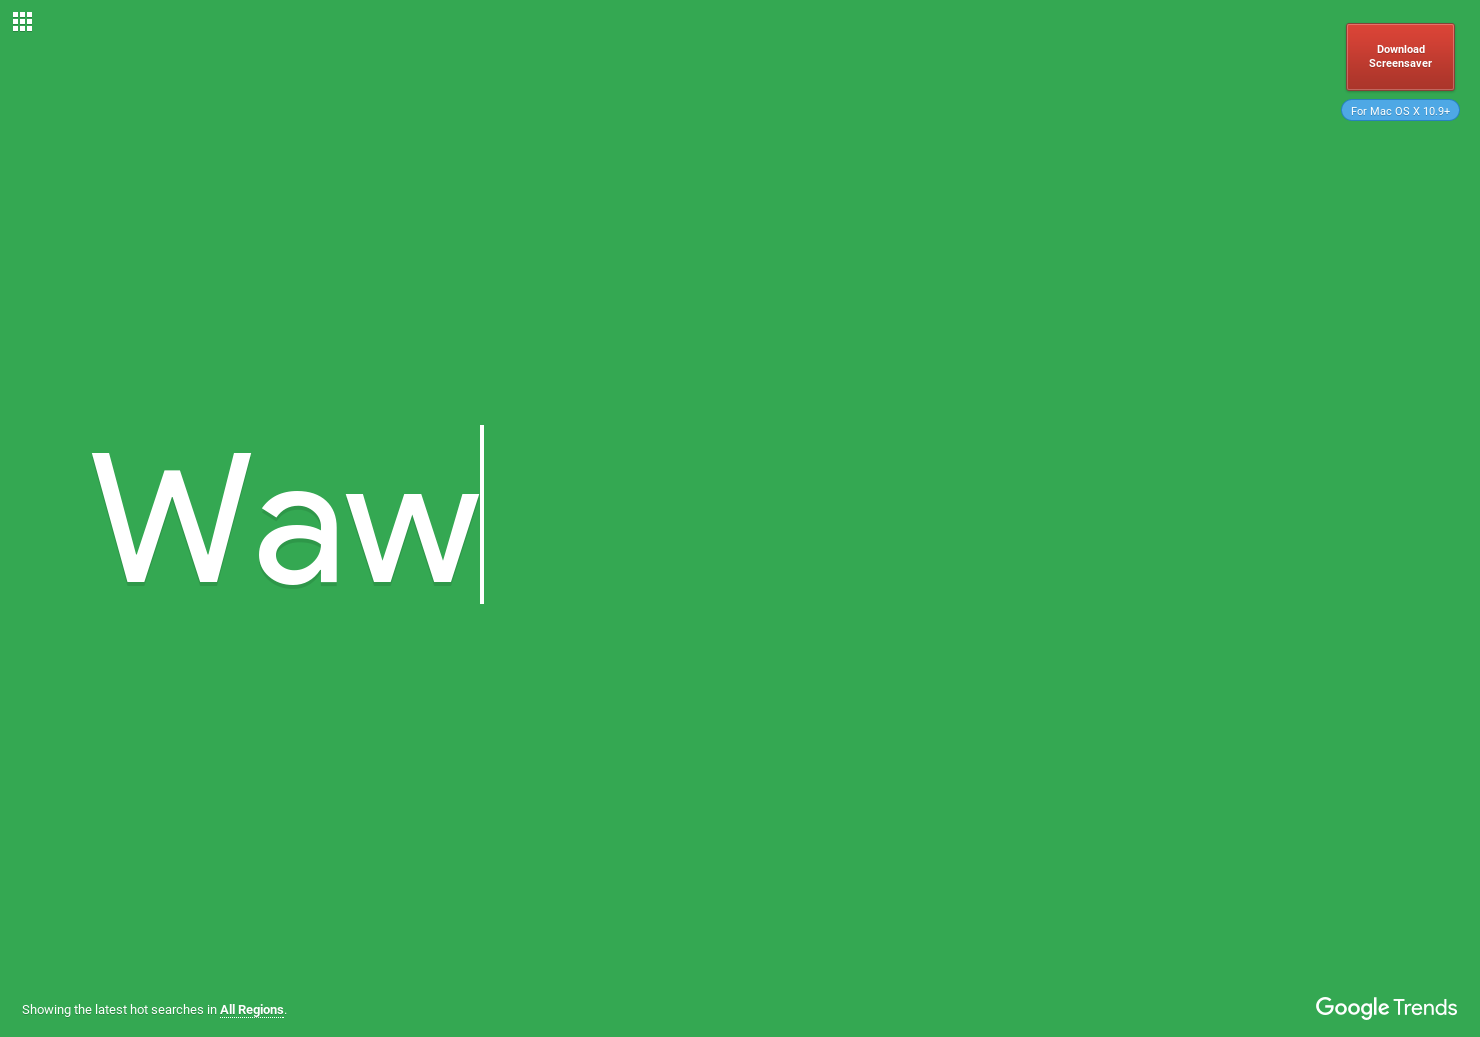
Beautifully visualize real-time search trends
2014 · trends.google.com · its alternatives →
- 4TA
Over the past few weeks I've been working on a small application to view trending repos on GitHub. I built the PWA[1] with React, Next.js and GraphQL .. but what's interesting is the application is only using React server side, meaning the client side javascript is only a few lines code adding some event listeners and registering a service worker for offline capability. This helped me achieve a perfect google chrome performance audit I learned a ton working on it and would love to talk about it if anyone has any questions! Application Link: https://trends.now.sh Source code on…
2018 · its alternatives →
- 5

Globe wireframe visualizations in Golang. Contribute to mmcloughlin/globe development by creating an account on GitHub.
2017 · github.com · its alternatives →
- 6

- 7
 ReactGlobe▲75
Build interactive globe visualizations with ease 🌎
2019 · react-globe.netlify.com · its alternatives →
- 8
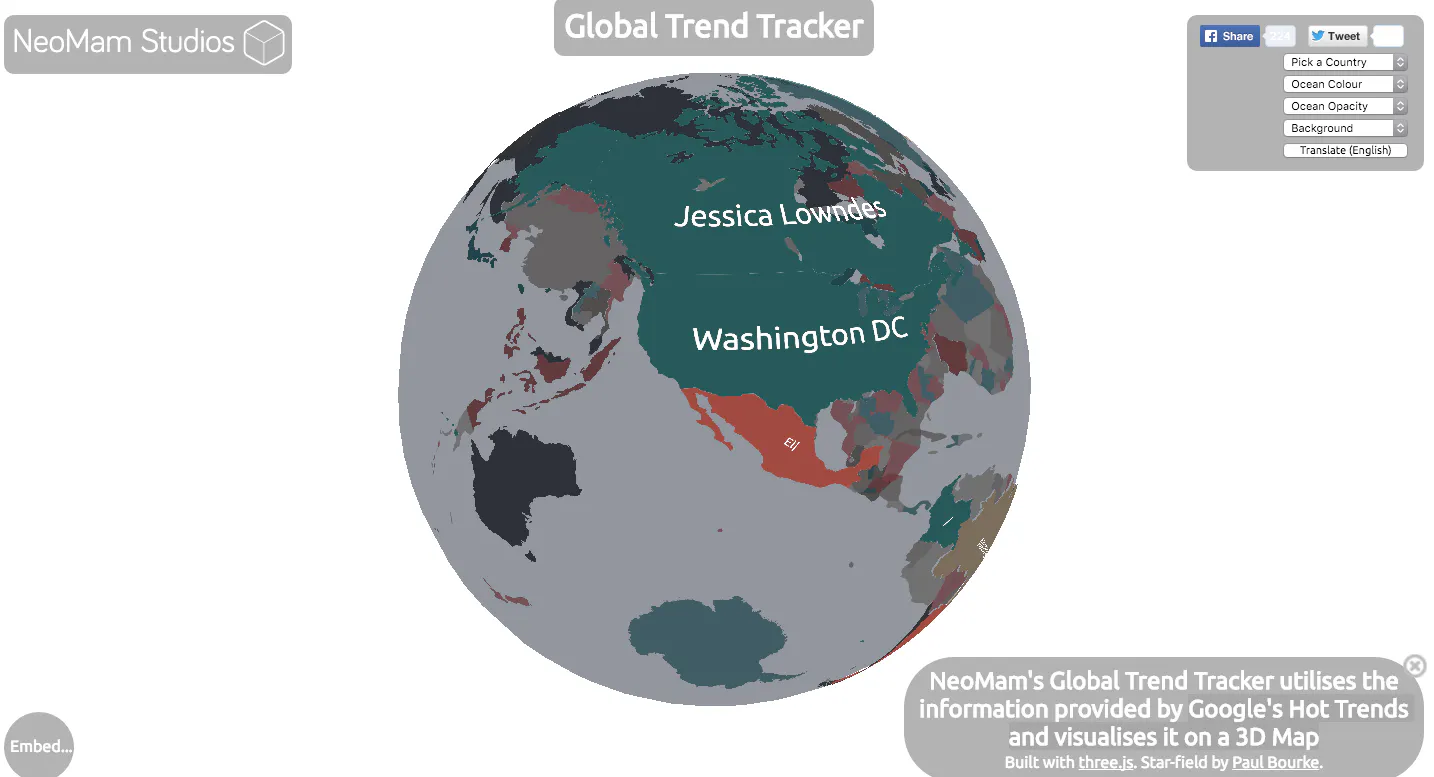
Google's Hot Trends visualised on a 3D Map
2016 · neomam.com · its alternatives →
- 9

- 10
 Gio.js▲77
3D globe info visualization library built with Three.js
2018 · github.com · its alternatives →
- 11

- 12

35+ Reports (Deloitte, Gartner, Google, etc.)
2020 · spacecadet.ventures · its alternatives →
- 13HC
2017 · hypewatching.com · its alternatives →
- 14
 Trends▲80
The fastest way to see whats trending on Github
2018 · trends.vercel.app · its alternatives →
- 15
- 16

Google Trends for analyzing news articles
2020 · muckrack.com · its alternatives →
- 17

Track Twitter Trends of any country and town
2021 · globaltwittertrends.com · its alternatives →
- 18MA
The concept for metiq.space came after playing Global Magnates with friends and realizing how fragmented live global data is. ships, aircraft, satellites, ports, weather, hazards, infrastructure, cyber, and public datasets all exist, but they usually live in separate tools and maps. The goal was to build one interactive 3D globe where live public data could be visualized by latitude, longitude, and altitude. Surface data stays on the globe, while aircraft, satellites, and other above surface things can be represented in actual 3D space instead of being flattened onto a map. The outcome is an…
Jun 2026 · metiq.space · its alternatives →
- 19
 Globe 3D▲151
Convert your design into an interactive 3D globe
2021 · globe-3d.vercel.app · its alternatives →
- 20

- 21

🌏 A Declarative 3D Globe Data Visualization Library built with Three.js - syt123450/giojs
2018 · github.com · its alternatives →
- 22
- 23

- 24
 Chart.js 4.0▲111
Open source JavaScript charting library for the modern web
2022 · github.com · its alternatives →
Also compare
Ranked by how close each launch is in meaning, then by votes. Prices were read from each product’s own site when checked and can change. Refine with your own description →