Growth · alternatives · 2026

24 alternatives to HyperCharts
Clear financials and business metrics of public companies
Below are 24 products that do a similar job, ranked by how close each is in meaning and then by launch-day votes. HyperCharts launched in 2019; newer entries below may have overtaken it.
- 1
 Air Charts▲73
Simple, beautiful, powerful financial charts for investing
2024 · apps.apple.com · its alternatives →
- 2
 Highcharts▲75
Add interactive charts to any platform, of any size.
2014 · highcharts.com · its alternatives →
- 3
 Ticker Nerd▲112
Analysing hot stocks before the hype train arrives
2021 · tickernerd.com · its alternatives →
- 4

- 5

Track insider trading by public companies. See the latest transactions, the top transactions over the last month, and search insider trading by company.
2020 · quiverquant.com · its alternatives →
- 6

- 7

Turn stock tickers into charts on Twitter
2020 · chromewebstore.google.com · its alternatives →
- 8

- 9

Assess the impact of financial news topics on asset prices
2024 · tradervoice.ai · its alternatives →
- 10

An open-source web app to explore hyped stocks on Reddit
2021 · github.com · its alternatives →
- 11
 SmartCharts▲47
The World’s First AI-Powered Trading Analysis Platform.
2024 · smartcharts.net · its alternatives →
- 12
- 13

An easy visual way to keep tabs on the stockmarket outlook
2023 · chartstorm.info · its alternatives →
- 14

- 15

- 16IB
Hi HN, I built a website myfinsight.com that aims to make complicated company financials easy to understand. The problem: The go-to place for financial data such as revenue, sales, net income is Yahoo finance. However, their data is usually wrong and very limited. The numbers are hard to digest to get insight quickly. There are also numerous websites that provide much better data for a very expensive monthly fee. Solution: a website that provides free diagrams and charts that visualize important financial data, such as income growth rate by date, revenue breakdown etc. It is free because the…
Nov 2025 · myfinsight.com · its alternatives →
- 17

the one page visual model to understand financial statements
2016 · amazon.com · its alternatives →
- 18
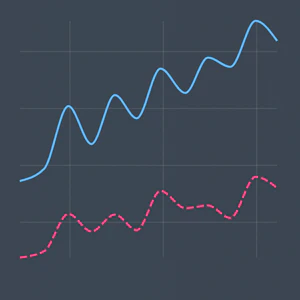
Visualised Financial information at your fingertip
2020 · stockfrontier.com · its alternatives →
- 19VB
Your personalised financial dashboard on Tijori Finance. View portfolio, watchlists, alerts, and market insights at a glance.
2020 · tijorifinance.com · its alternatives →
- 20RG
2018 · restcharts.com · its alternatives →
- 21

- 22
- 23WB
Most analytics tools give you 10–15 chart types and call it a day. But what happens when none of them actually represent your data well? We ran into this when building a CRM dashboard. We wanted to show how sales reps connect to open deals: not just totals, but actual relationships. A bar chart was too flat, a table too dense. We needed a network graph. The problem? Most chart libraries and BI tools don’t support that out of the box. You either say “no” to the feature request, or you hack together a standalone visualization that breaks the product’s flow (no filters, no interactivity, no…
Oct 2025 · its alternatives →
- 24CP
2012 · excharts.com · its alternatives →
Also compare
Ranked by how close each launch is in meaning, then by votes. Prices were read from each product’s own site when checked and can change. Refine with your own description →