Commerce · alternatives · 2026
24 alternatives to Visual breakdown of S&P 500 companies
Your personalised financial dashboard on Tijori Finance. View portfolio, watchlists, alerts, and market insights at a glance.
Visual breakdown of S&P 500 companies is a tool that displays information about the companies in the S&P 500 index in a visual format. It is designed for investors and people interested in understanding the composition… Below are 24 products that do a similar job, ranked by how close each is in meaning and then by launch-day votes. Visual breakdown of S&P 500 companies launched in 2020; newer entries below may have overtaken it.
- 1

- 2CO
2020 · quiverquant.com · its alternatives →
- 3

Track insider trading by public companies. See the latest transactions, the top transactions over the last month, and search insider trading by company.
2020 · quiverquant.com · its alternatives →
- 4
 TradingView▲300
The best charting tool for crypto and stocks
2014 · tradingview.com · its alternatives →
- 5
 TNW Index▲409
Keep track of companies & markets you care about
2015 · thenextweb.com · its alternatives →
- 6
 HyperCharts▲91
Clear financials and business metrics of public companies
2019 · hypercharts.co · its alternatives →
- 7IM
(* within a few minutes of SEC filing) Currently does it for 1000+ US companies and specifically earnings related filings. By US companies, I mean the ones that are obliged to file SEC filings. This was the result of almost a year long effort and hundreds of prototypes :) It currently auto-publishes for 1000 ish US companies by market cap, relies on 8-K filing as a trigger. e.g. https://www.signalbloom.ai/news/NVDA will take you to NVDA earnings Would be grateful to get some feedback. Especially if you follow a company, check its reports out. Thank you! Some examples:…
2025 · signalbloom.ai · its alternatives →
- 8
 Air Charts▲73
Simple, beautiful, powerful financial charts for investing
2024 · apps.apple.com · its alternatives →
- 9

Visualize and compare the impact of news events on industry share prices
2018 · scatterstocks.com · its alternatives →
- 10
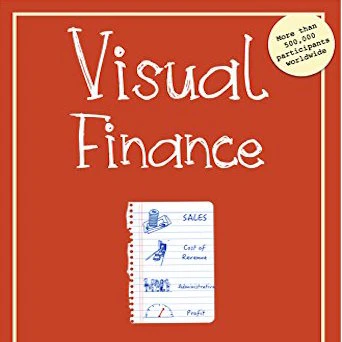
the one page visual model to understand financial statements
2016 · amazon.com · its alternatives →
- 11RU
The next generation of investment research
2020 · quiverquant.com · its alternatives →
- 12

Visual Marketing Index | Instagram analytics tool for brands
2017 · getflowbox.com · its alternatives →
- 13

Research, charts, and filings intelligence for public companies. Fast, clean, and built for analysts.
2025 · publicview.ai · its alternatives →
- 14

Read the Tape gives players the same 5 S&P500 stock charts per day to predict. You select low, medium or high confidence and then call the chart UP or DOWN. It's a 1d chart which then resolves over 5 days. Alpha is scored against the Monkey Index, a basket of 11 random coin flips at low confidence which provides a tangible win/lose condition. We're two weeks in and some interesting data is being kicked up. Players like to call tops even though stonks go up- 60% of the 70 charts so far resolve higher, players' down calls have only been right 31% of the time. There's a full stats dive at…
Jul 2026 · readthetape.cc · its alternatives →
- 15

My main motivation was that I wanted to be able to drill down and filter across all the available stocks, look at the data for myself, and narrow down on the stocks I am interested based on my own sets of criteria, and make data-driven analysis for my personal investment strategies. I used PostgreSQL as the backend database for ELT data pipelines, and used Citus Data cstore_fdw for columnar compression for the final dataset. All financial data is coming from SEC Edgar, https://www.sec.gov/developer. I used Python for downloading most of the data. I also run the data load…
2023 · tesseractanalytics.ai · its alternatives →
- 16

Assess the impact of financial news topics on asset prices
2024 · tradervoice.ai · its alternatives →
- 17

The up-to-date list of all the companies in the S&P 500.
2024 · its alternatives →
- 18

- 19

The ultimate stock tracking tool to maximize your returns
2018 · apps.apple.com · its alternatives →
- 20FI
ShareSEER is a research tool for investors. We are excited to announce the launch V 1.3 of ShareSEER. We now have: - A real time insider filing dashboard - https://shareseer.com/today/insiders . View live sales and purchases of stocks by company insiders! Get information one day faster than in major brokerages. Filter by existing companies. - A risk extractor which highlights unique risks for S & P 500 companies. e.g - https://shareseer.com/analysis/risks?tick=MOS -We augment the existing feature of searching for 10-k/10-Q's for a given company…
2018 · its alternatives →
- 21SW
2014 · simplywall.st · its alternatives →
- 22

- 23AT
2020 · buildorgchart.herokuapp.com · its alternatives →
- 24
 Market Pulse▲19
Your market dashboard, always within reach.
2025 · chromewebstore.google.com · its alternatives →
Also compare
Ranked by how close each launch is in meaning, then by votes. Prices were read from each product’s own site when checked and can change. Refine with your own description →