Dev tools · alternatives · 2026

24 alternatives to Latency.at Public Metrics
Free Prometheus Performance Metrics of Cloud providers
Below are 24 products that do a similar job, ranked by how close each is in meaning and then by launch-day votes. Latency.at Public Metrics launched in 2017; newer entries below may have overtaken it.
- 1

Off-premises insight for your on-premises Prometheus servers
2017 · latency.at · its alternatives →
- 2CC
2017 · cclatency.com · its alternatives →
- 3
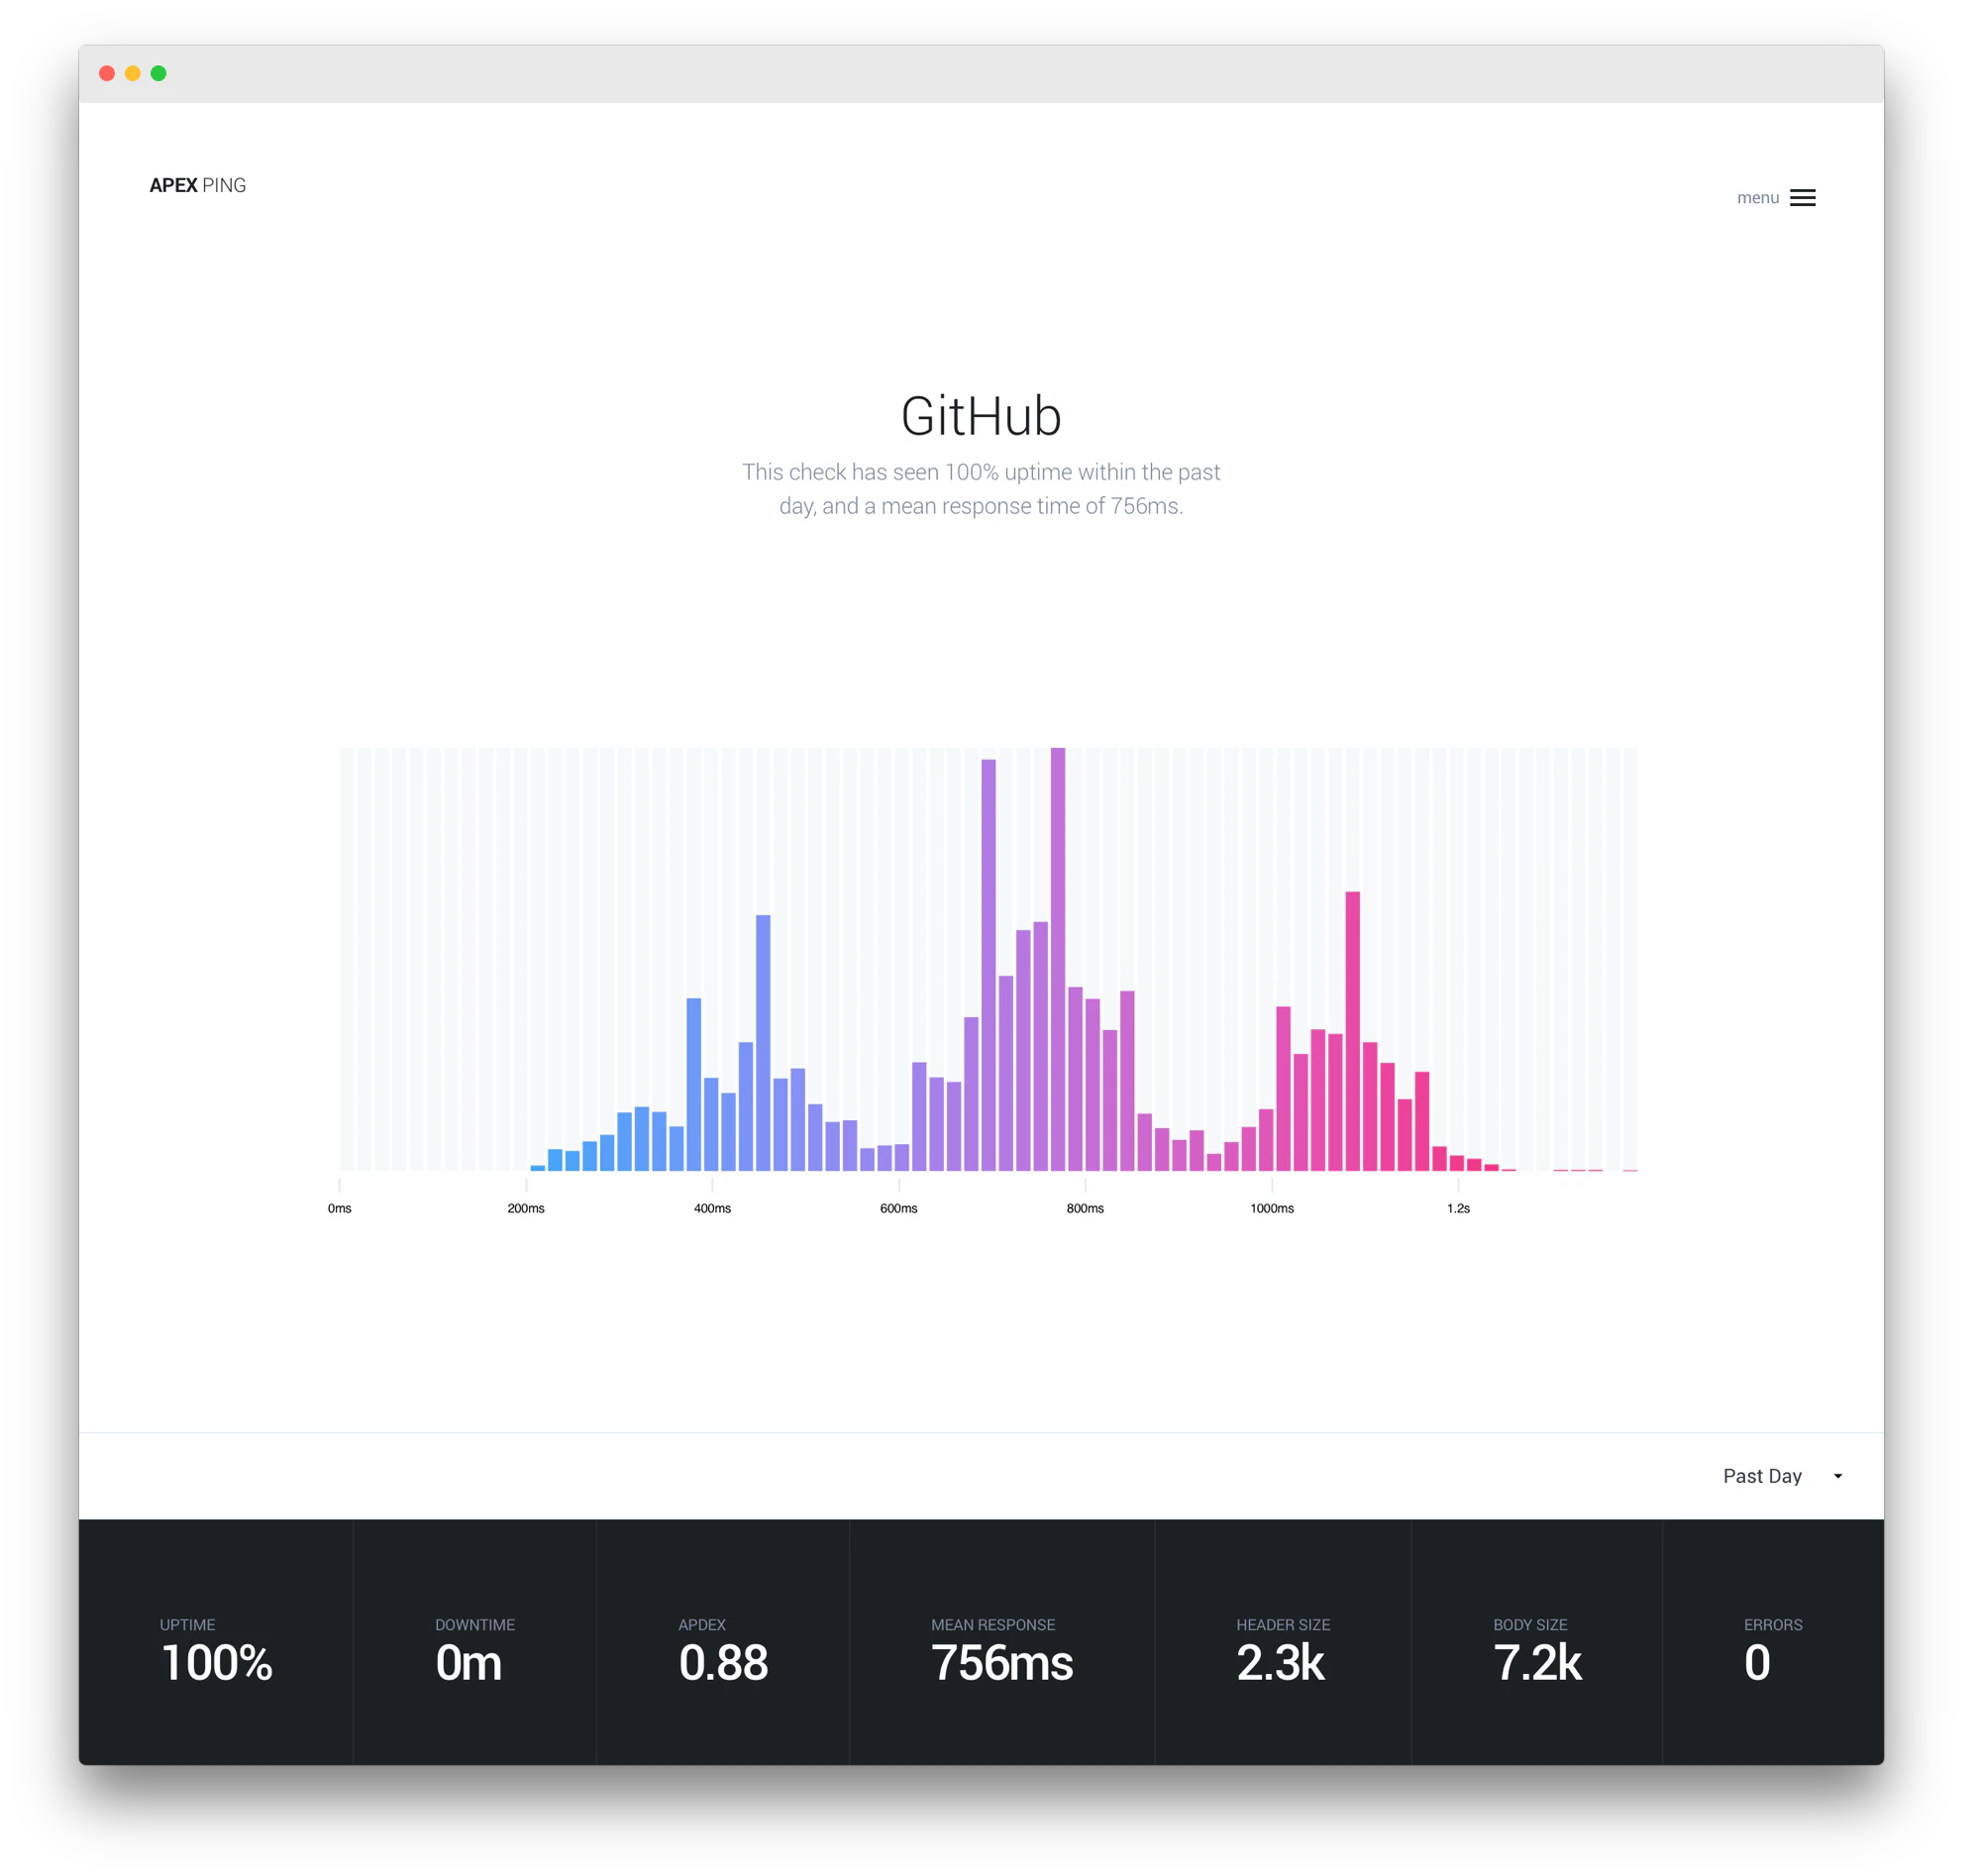
- 4
 Temporal Cloud▲337
OpenAI and Temporal have teamed up to add Durable Execution to agents built using OpenAI’s Agents SDK, and today we released the new integration in Public Preview.
2024 · temporal.io · its alternatives →
- 5
 Metric.live▲180
Real-time and advanced periodic alerts for Google Analytics.
2017 · metric.live · its alternatives →
- 6

- 7
 Lighthouse 8.0▲330
Analyze web apps & sites, collect modern performance metrics
2021 · developer.chrome.com · its alternatives →
- 8

2021 · github.com · its alternatives →
- 9OP
2017 · latency.at · its alternatives →
- 10

The simplest, fastest, & cheapest way to monitor performance
2020 · requestmetrics.com · its alternatives →
- 11
 Middleware▲257
Open-source DORA metrics for software engineering teams
2024 · github.com · its alternatives →
- 12

A generic latency benchmarking library. Contribute to tylertreat/bench development by creating an account on GitHub.
2015 · github.com · its alternatives →
- 13

- 14
 Density▲381
A modern infrastructure for anonymously counting people
2016 · density.io · its alternatives →
- 15
 APImetrics▲72
Simple, powerful, secure API performance monitoring
2021 · apicontext.com · its alternatives →
- 16PR
See metrics from all of your apps, tools & services in one place with Datadog’s cloud monitoring as a service solution. Try it for free.
2012 · datadoghq.com · its alternatives →
- 17

- 18

Optimize your website's performance
2023 · lighthouse-metrics.com · its alternatives →
- 19

Metrics, a real-time monitoring tool for your apps
2018 · cdn.clever-cloud.com · its alternatives →
- 20

Anonymized usage data to make your product phenomenal
2023 · telemetrydeck.com · its alternatives →
- 21
 Baselime▲120
Observability & error tracking for cloud applications
2024 · baselime.io · its alternatives →
- 22

A Go library for collecting sql.DBStats in Prometheus format - dlmiddlecote/sqlstats
2019 · github.com · its alternatives →
- 23
 Speedometer 3.0▲131
Benchmarking app performance on the modern web
2024 · github.com · its alternatives →
- 24

Uptrace is an all-in-one tool that supports distributed tracing, metrics, and logs. It uses OpenTelelemetry observability framework to collect data and ClickHouse database to store it. You can ingest data using OpenTelemetry Protocol (OTLP), Vector Logs, and Zipkin API. You can also use OpenTelemetry Collector to collect Prometheus metrics or receive data from Jaeger, X Ray, Apache, PostgreSQL, MySQL and many more. The latest Uptrace release introduces support for OpenTelemetry Metrics which includes: - User interface to build table-based and grid-based dashboards. - Pre-built dashboard…
2022 · app.uptrace.dev · its alternatives →
Also compare
Ranked by how close each launch is in meaning, then by votes. Prices were read from each product’s own site when checked and can change. Refine with your own description →