Dev tools · alternatives · 2026

24 alternatives to Percival
A reactive language for data analysis and visualization
Below are 24 products that do a similar job, ranked by how close each is in meaning and then by launch-day votes. Prices are shown for the 1 we have checked on their own sites, 1 of them free or with a free tier. Percival launched in 2021; newer entries below may have overtaken it.
- 1

📝 Web-based, reactive Datalog notebooks for data analysis and visualization - ekzhang/percival
2021 · github.com · its alternatives →
- 2

2015 · percy.io · its alternatives →
- 3

Creating data visualizations with AI nowadays often means chat, chat and more chats...and writing long prompts can be annoying while they are also not the most effective way to describe your visualization designs. Data Formulator blends UI interaction with natural language so that you can create visualizations with AI much more effectively! You can: * create rich visualizations beyond initial datasets, where AI helps transforming and visualizing data along the way * iterate your designs and dive deeper using data threads, a new way to manage your conversation with AI. Here is a demo video:…
2024 · github.com · its alternatives →
- 4

Data visualizations are the bridge between user and data. But building AI agents that can generate visualizations reliably can be very tricky: - simple chart specs can be reliable, but generated charts are often of low quality due to reliance on system defaults; - complex chart specs with explicit details can produce good-looking charts, but they are verbose and agents can struggle with reliability We figured out it is a limitation on the language issue (not just AI capability thing) -- current visualization languages are a bit too low-level for AI agents, requiring them to explicitly make…
Jul 2026 · microsoft.github.io · its alternatives →
- 5ON
2018 · beta.observablehq.com · its alternatives →
- 6
- 7

Visual explanations of Algorithms and Data structures
2020 · chrislaux.com · its alternatives →
- 8GB
2018 · amie.ai · its alternatives →
- 9

Write down your algorithm to be visualized
2016 · jasonpark.me · its alternatives →
- 10

- 11
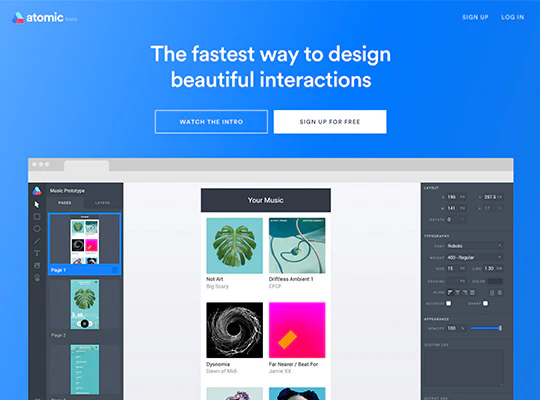
 Atomic.io 2.0▲328
Ultra fast, scalable and fully collaborative prototyping
2016 · atomic.io · its alternatives →
- 12

Here's a project I've been working on for a little while now. Ripl is a JS library that provides a unified API for rendering shapes on both canvas and SVG interchangeably. Over the years I've used D3 extensively to create data visualisations so I figured I'd have a go at making my own version with a slightly more modern API and stricter TypeScript support. I am aware there are already libraries that can draw to multiple contexts interchangeably, but I've added a few little niceties to Ripl that (as far as I know) some other libraries don't have such as CSS-like query selectors, DOM-like…
2024 · github.com · its alternatives →
- 13

Build frontend browser apps with Rust + WebAssembly. Supports server side rendering. - chinedufn/percy
2018 · github.com · its alternatives →
- 14

- 15

Graphic is a grammar of data visualization and Flutter charting library, with there features: - A Grammar of Graphics: Graphic derives from Leland Wilkinson's book The Grammar of Graphics, and tries to balance between theoretical beauty and practicability. It inherits most concepts, like the graphic algebra. - Declarative and Reactive: As is encouraged in Flutter, the chart widget of Graphic is declarative and reactive. The grammar of data visualization is implemented by a declarative specification and the chart will reevaluate automatically on widget update. - Interactive: With the signal…
2023 · github.com · its alternatives →
- 16

Directed acyclic graphs are muched discussed in comp-sci, but octopus appears to be the first reusable, turnkey, ready-to-wear, off-the-shelf implementation of a DAG for application development, in any language, that I'm aware of. This is remarkable because DAGs hit a sweet spot in the middle of the three common programming paradigms (OO, event-driven, functional). Let's have a DAG as the top-level structure of our applications. Data-fetching and onChange handlers live in DAG nodes, next to the data they act on. The UI flows out from the DAG with fine-grained reactivity. Our app state is…
2023 · github.com · its alternatives →
- 17

- 18

Charts and infographics constructor in Figma
2021 · store.123d.one · its alternatives →
- 19

- 20

Reference tool for data visualisation
2016 · datavizcatalogue.com · its alternatives →
- 21

A data aware UI components library for building realtime maps - reactivemaps/README.md at master · appbaseio/reactivemaps
2017 · github.com · its alternatives →
- 22
 CLUBASID▲65
A no-code story-telling data visualisation and insight tool
2022 · apps.microsoft.com · its alternatives →
- 23SA
Sabela is a reactive notebook for Haskell. The name is the Ndebele word for "to respond." Cells respond to each other on change. Initially it was meant as a tool for working with data but it has turned out to have a lot of pedagogical value outside of data analysis work. There is a gallery to read through on the website and a number of examples in the repo showcasing things like: * Python interop * Widgets and animation * Exploratory data analysis If you find any of this interesting please try it out. Any feedback is welcome.
Jun 2026 · sabela.datahaskell.com · its alternatives →
- 24

Find the origin of any character in the DOM
2019 · fromjs.com · its alternatives →
Also compare
- Percival – Web-based reactive Datalog notebooks, made with Rust+Svelte alternatives
- Percy.io, a continuous visual integration tool alternatives
- Data Formulator – AI-powered data visualization from Microsoft Research alternatives
- Microsoft releases Flint, a visualization language for AI agents alternatives
- Observable Notebooks alternatives
- Atomic alternatives
Ranked by how close each launch is in meaning, then by votes. Prices were read from each product’s own site when checked and can change. Refine with your own description →