Dev tools · alternatives · 2026

24 alternatives to Plottable.js
Flexible, interactive charts for the web.
Below are 24 products that do a similar job, ranked by how close each is in meaning and then by launch-day votes. Plottable.js launched in 2016; newer entries below may have overtaken it.
- 1
 Chart.js▲263
Simple, clean & engaging charts for designers and developers
2014 · chartjs.org · its alternatives →
- 2
 Chart.js 2.0▲440
Simple, clean & engaging charts for designers & developers.
2016 · chartjs.org · its alternatives →
- 3
 Chart.js 4.0▲111
Open source JavaScript charting library for the modern web
2022 · github.com · its alternatives →
- 4TL
2018 · charts.com · its alternatives →
- 5GJ
Grid.js is a lightweight JavaScript table plugin that works on all web browsers and devices. Grid.js is open-source and it helps you create advanced tables in seconds!
2020 · gridjs.io · its alternatives →
- 6

Free JavaScript library for data visualization & analysis
2019 · webdatarocks.com · its alternatives →
- 7AJ
2012 · segmentio.github.com · its alternatives →
- 8

Create pro-level graphs that drive actions
2024 · graphy.app · its alternatives →
- 9

- 10

- 11

📈 A small, fast chart for time series, lines, areas, ohlc & bars - leeoniya/uPlot
2019 · github.com · its alternatives →
- 12

Responsive HTML5 charts with 10x performance
2017 · canvasjs.com · its alternatives →
- 13
 ChartURL▲272
Create image charts on the fly for web, mobile, and email
2015 · charturl.com · its alternatives →
- 14

How to use the Plotly.js React component.
2016 · academy.plot.ly · its alternatives →
- 15

Many JS libraries exist to build graphs on the web (Vega, chartJS, Plotly...). They allow to make charts quickly. But you lose flexibility: you're limited by the options they offer. I just created a gallery with hundreds of graphs made with d3.js and React. - Examples are split by graph types - They all come with explanation and code sandboxes - Gradual complexity to ease the learning curve It took me ages to create this project! Feedback welcome!
2023 · react-graph-gallery.com · its alternatives →
- 16

- 17
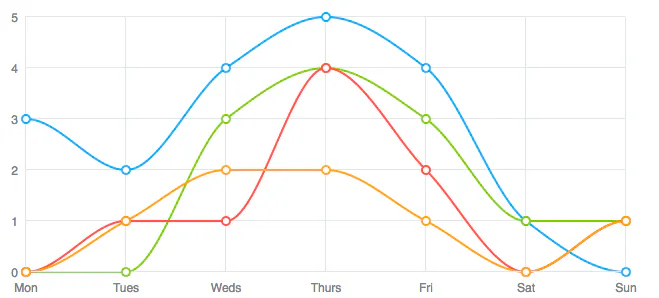 ZingChart▲92
JS Charting library that renders in HTML5, Canvas & Flash
2014 · zingchart.com · its alternatives →
- 18

Create interactive data tables in seconds with Tabulator. A free, open source, fully featured JavaScript table / data grid generation library.
2018 · tabulator.info · its alternatives →
- 19

Hey HN! We are Jonathan & Guy, and we are happy to share a project we’ve been working on. ChartDB is a tool to help developers and data analysts quickly visualize database schemas by generating ER diagrams with just one query. A unique feature of our product is AI-Powered export for easy migration. You can give it a try at https://chartdb.io and find the source code on GitHub. Next steps ---> More AI. We’d love feedback :)
2024 · github.com · its alternatives →
- 20

- 21

- 22
 Recharts▲155
A composable charting library built on React components
2016 · recharts.org · its alternatives →
- 23
 AnyChart▲136
Interactive JavaScript HTML5 based charting solution
2015 · anychart.com · its alternatives →
- 24
 Rough Charts▲145
A responsive react charting library with a hand-drawn style.
2019 · github.com · its alternatives →
Also compare
Ranked by how close each launch is in meaning, then by votes. Prices were read from each product’s own site when checked and can change. Refine with your own description →