Life & fun · alternatives · 2026

24 alternatives to QuickHPC – Hardware Performance Counters Made Easy
An easy to use tool to stream hardware performance counters data as CSV - elchiapp/quickhpc
QuickHPC is a tool that captures hardware performance counter data and outputs it as CSV files. It's designed for developers and system administrators who need to analyze processor and system performance metrics. The… Below are 24 products that do a similar job, ranked by how close each is in meaning and then by launch-day votes. QuickHPC – Hardware Performance Counters Made Easy launched in 2015; newer entries below may have overtaken it.
- 1H2
2016 · hisham.hm · its alternatives →
- 2

Hi HN! We’re Arthur and Adrien from CodSpeed. We’re building a tool measuring software performance before any production deployment, catching performance regressions before they hit production environments and reporting performance changes directly in Pull Request comments. It’s kind of like Codecov but for performance measurement. Today, the go to solution to measure performance is probably to use an APM(DataDog, Sentry, …), continuously analyzing your production environment. However, since those solutions are operating on real environments they need real users to experience poor…
2023 · codspeed.io · its alternatives →
- 3

A flamegraph generator for Postgres EXPLAIN ANALYZE output. - mgartner/pg_flame
2019 · github.com · its alternatives →
- 4UB/usr/bin/htop▲219
2017 · 0xfee1dead.top · its alternatives →
- 5
- 6

The standard GPU utilization metric reported by nvidia-smi, nvtop, Weights & Biases, Amazon CloudWatch, Google Cloud Monitoring, and Azure Monitor is highly misleading. It reports the fraction of time that any kernel is running on the GPU, which means a GPU can report 100% utilization even if only a small portion of its compute capacity is actually being used. In practice, we've seen workloads with ~1–10% real compute throughput while dashboards show 100%. This becomes a problem when teams rely on that metric for capacity planning or optimization decisions, it can make underutilized systems…
Apr 2026 · systalyze.com · its alternatives →
- 7

pg_netstat is a Postgres extension to monitor database network traffic. It uses libpcap to capture packets and aggregates at user-specified interval.
2022 · github.com · its alternatives →
- 8

Hey HN. We’re Jay and Vadim from Highlight.io (https://highlight.io). We’re building an open source [1] monitoring platform for web applications. Today we’re excited to be sharing a performance tool we’ve been working on, which helps you inspect the latency of code execution from the client to the server. As engineers at past startups, we often had to debug slow queries, poor load times, inconsistent errors, etc... While tools like Jaegar [2] helped us inspect server-side performance, we had no way to tie user events to the traces we were inspecting. In other words, although we had…
2024 · github.com · its alternatives →
- 9SA
I've frequently found myself using [nvitop](https://github.com/XuehaiPan/nvitop) to diagnose GPU/CPU contention issues. The two best things about it are: - It's easy to install if I can access pip in the container - It makes a compelling screenshot (which helps me communicate with coworkers.) With those two lessons in mind: Here is Sping! Purpose: Help observe and diagnose latency issues at layer 4+ (TCP/HTTP/HTTPS) Two good things about it: - It's easy to install if you have pip. (Available at…
2025 · dseltzer.gitlab.io · its alternatives →
- 10

- 11

allocscope - a memory tracking tool. Contribute to matt-kimball/allocscope development by creating an account on GitHub.
2023 · github.com · its alternatives →
- 12

Coppers is a custom test harnass for Rust that measures the energy usage of your test suite. - ThijsRay/coppers
2022 · github.com · its alternatives →
- 13

A command-line benchmarking tool. Contribute to sharkdp/hyperfine development by creating an account on GitHub.
2018 · github.com · its alternatives →
- 14

🔎 Monitor deep learning model training and hardware usage from your mobile phone 📱 - labml/guides/hardware_monitoring.md at master · labmlai/labml
2021 · github.com · its alternatives →
- 15RT
2012 · dashboard.graphdat.com · its alternatives →
- 16

A command-line benchmarking tool. Contribute to sharkdp/hyperfine development by creating an account on GitHub.
2019 · github.com · its alternatives →
- 17

Hey HN, I made a Windows process monitor for app developers and advanced end users. I wanted a taskmgr system-level graph view per app. Windows procmon, while capable, has always been tedious to set up (esp. if not used often). That's pretty much the whole idea behind the app--to simplify app-level monitoring, to make it easy. I hope some of you find it useful!
2025 · pragmar.com · its alternatives →
- 18

Free tool to automate media performance monitoring
2024 · imagekit.io · its alternatives →
- 19
 Trace▲85
A lightweight GraphQL query performance monitoring dev tool
2021 · gotrace.info · its alternatives →
- 20

Note: this is an update to [this](https://news.ycombinator.com/item?id=44568529) "Show HN" post. timep is a state-of-the-art [debug-]trap-based bash profiler that is efficient and extremely accurate. Unlike other profilers, timep records: 1. per-command wall-clock time 2. per-command CPU time, and 3. the hierarchy of parent function calls /subshells for each command the wall-clock + CPU time combination allows you to determine if a particular command is CPU-bound or IO-bound, and the hierarchical logging gives you a map of how the code actually executed. The standout…
2025 · github.com · its alternatives →
- 21

The simplest, fastest, & cheapest way to monitor performance
2020 · requestmetrics.com · its alternatives →
- 22

2021 · prodfiler.com · its alternatives →
- 23

Clean hardware and cognitive benchmarking tools.
Jul 2026 · inputbenchmark.com · its alternatives →
- 24

I built a small Linux tool to deterministically verify GPU PCIe link health and bandwidth. It reports: - Negotiated PCIe generation and width - Peak Host→Device and Device→Host memcpy bandwidth - Sustained PCIe TX/RX utilization via NVML - A rule-based verdict derived from observable hardware data only This exists because PCIe issues (Gen downgrades, reduced lane width, risers, bifurcation) are often invisible at the application layer and can’t be fixed by kernel tuning or async overlap. Linux-only: it relies on sysfs and PCIe AER exposure that Windows does not provide.
Dec 2025 · github.com · its alternatives →
Also compare
- Htop 2.0 released, now cross-platform alternatives
- CodSpeed – Continuous Performance Measurement alternatives
- pg_flame – flamegraph visualizations of PostgreSQL query plans alternatives
- /usr/bin/htop alternatives
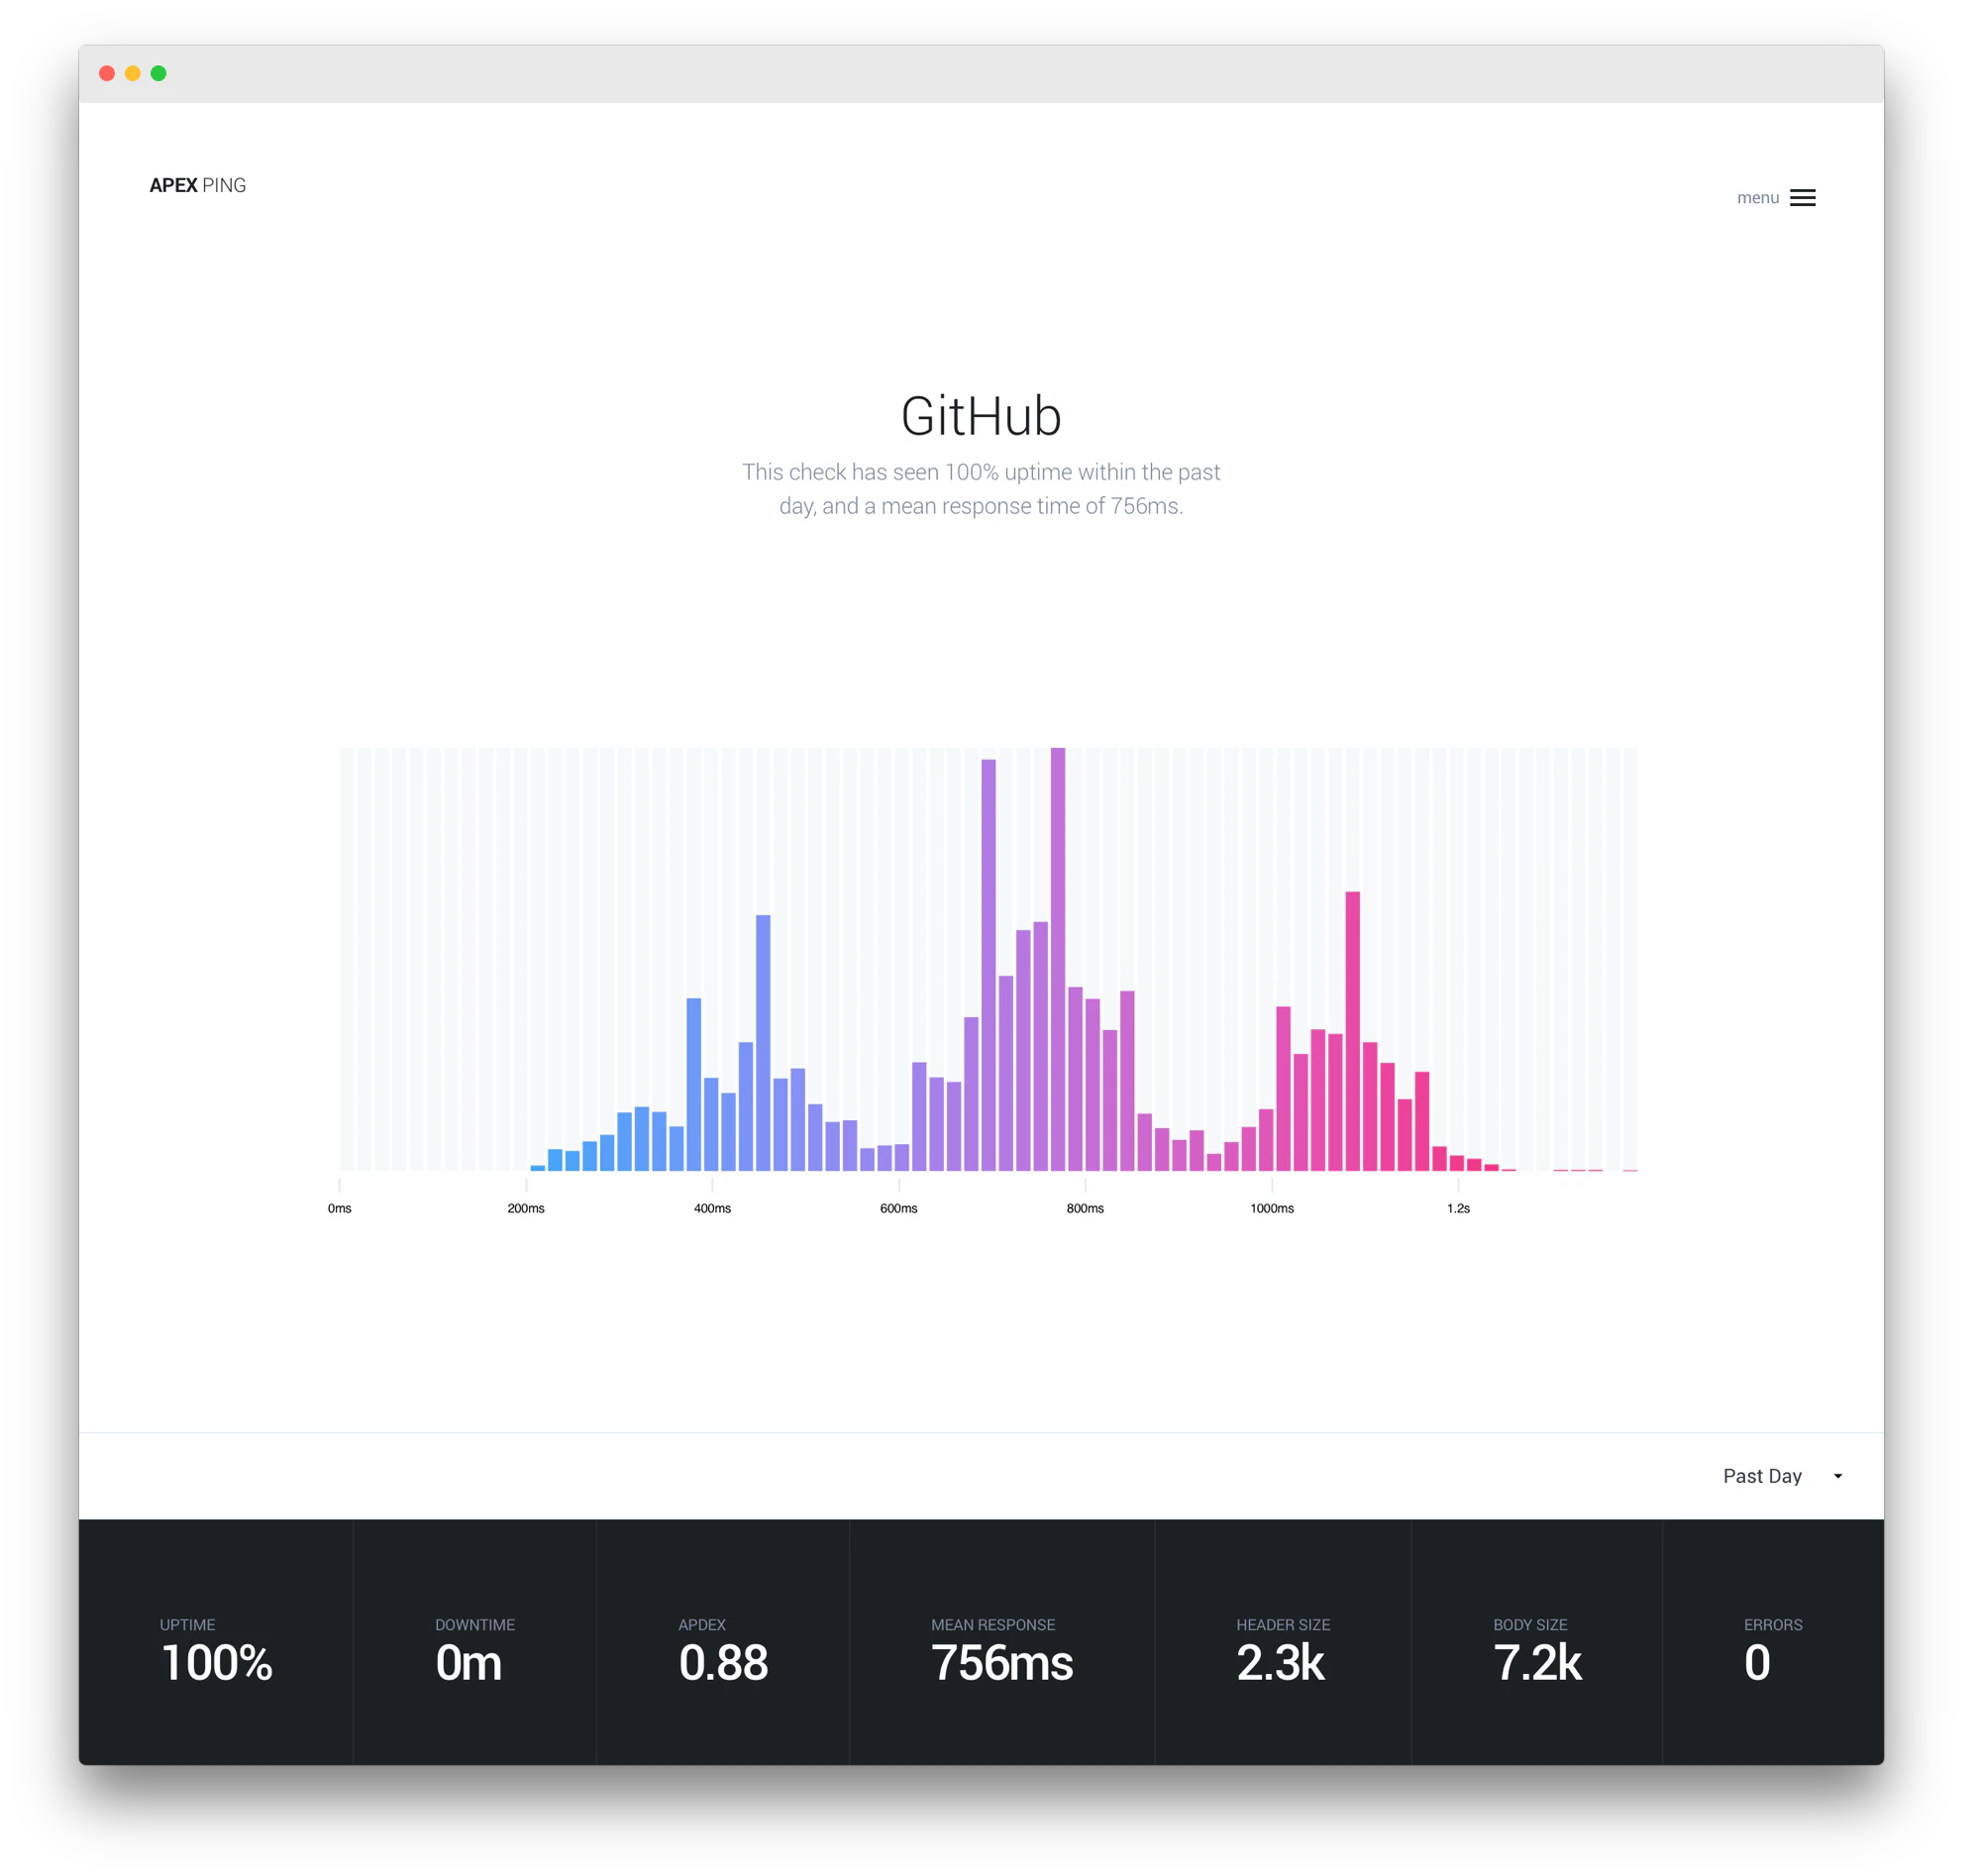
- Apex Ping alternatives
- Utilyze – an open source GPU monitoring tool more accurate than nvtop alternatives
Ranked by how close each launch is in meaning, then by votes. Prices were read from each product’s own site when checked and can change. Refine with your own description →