Life & fun · alternatives · 2026
24 alternatives to QuickViz – Create complex charts, graphs and formulas using Markdown
Below are 24 products that do a similar job, ranked by how close each is in meaning and then by launch-day votes. QuickViz – Create complex charts, graphs and formulas using Markdown launched in 2020; newer entries below may have overtaken it.
- 1

- 2

- 3

- 4

- 5

Inspired by the design and UI/UX of apps like Notion, and utility of open-source apps like StackEdit, I decided to create a minimalistic, local-only WYSIWYG Markdown editor. Some features worth highlighting: - Monaco editor and Prettier integration for code snippets - Tables (apparently the holy grail of WYSIWYG editing) - Embeds (for CodePen, CodeSandbox and YouTube, most useful for HTML or JSON exports) - Accepts Markdown paste-in, and "exports"/generates HTML, Markdown and JSON outputs - Collaboration (with real-time awareness and initial commenting system, available only when…
2023 · editor.vrite.io · its alternatives →
- 6

- 7
 Data Wrapper▲75
Open source simple, correct, embeddable charts in minutes
2014 · datawrapper.de · its alternatives →
- 8

- 9

Free online tool to create beautiful charts
2024 · textquery.app · its alternatives →
- 10
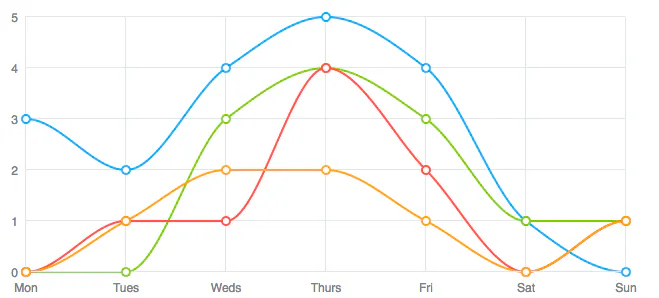 ZingChart▲92
JS Charting library that renders in HTML5, Canvas & Flash
2014 · zingchart.com · its alternatives →
- 11ML
2013 · socrates.io · its alternatives →
- 12

- 13

A tool to create animated graph visualizations, based on graphviz. - GitHub - mapio/GraphvizAnim: A tool to create animated graph visualizations, based on graphviz.
2016 · github.com · its alternatives →
- 14

- 15AG
2021 · eviltester.github.io · its alternatives →
- 16SB
2015 · fast-eyrie-1730.herokuapp.com · its alternatives →
- 17US
2015 · imaginea.github.io · its alternatives →
- 18

Turn Tables Into Stunning Graphs-No Coding, Just Clarity!
2025 · its alternatives →
- 19

Hi HN, We're a small team working on a new dataviz engine and its applications. We built our charting engine in C++ and run it on WebAssembly. Two years ago, we launched Vizzu as an open-source animated data visualization library aimed at JS developers, allowing users to create dynamic charts. We also released a Python wrapper under the name ipyvizzu for data scientists. Since then, we've been working hard to make this technology accessible to everyone, regardless of their coding skills. Today, we're proud to introduce our no-code storytelling tool. With this tool, anyone can turn their…
2024 · vizzu.io · its alternatives →
- 20
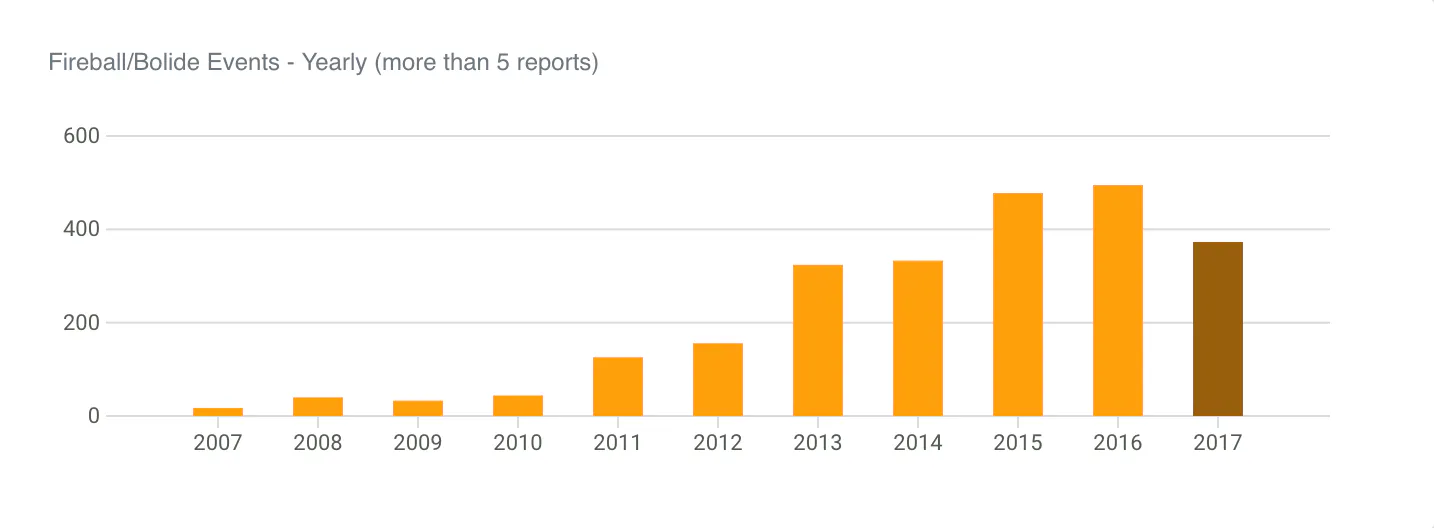 Charts▲8
A simple and responsive SVG chart lib with zero dependencies
2017 · frappe.github.io · its alternatives →
- 21AT
2020 · turboinfographic.com · its alternatives →
- 22

Visualize, edit, and convert Markdown instantly
2025 · markkit.dev · its alternatives →
- 23

Find the right data visualization tool: 291 charting libraries, maps, graph and network visualization, dashboards and more for JavaScript, Python, R and beyond, with live GitHub stars and activity.
18d ago · awesomedataviz.com · its alternatives →
- 24QS
2019 · app.quickmetrics.io · its alternatives →
Also compare
Ranked by how close each launch is in meaning, then by votes. Prices were read from each product’s own site when checked and can change. Refine with your own description →