Alternatives
Products that do what Recursive does
Visualize, Algorithms, Python, JavaScript, TypeScript
- 1TD
Made an online tool for creating diagrams with TypeScript. I quite like it for thinking about how to shape my data, even if I end up using a different language in the end.
2023 · tsdiagram.com
- 2VD
2020 · github.com
- 3

- 4DA
In the past I've used declarative diagram generation tools like Mermaid.js a lot for quickly drawing up things but for presentations or deliverables I find that I have to then move the generated diagrams over to a tool like Lucidchart which allows full control of the organization and customization. Therefore I am now working on this to combine the benefits of both into just one tool which can do both functions. The project is certainly in the early stages but if you find yourself making architecture diagrams I'd love to hear your thoughts on the idea or even a Github issue for a feature…
Oct 2025 · github.com
- 5CC
2020 · codemap.app
- 6PI
Hi HN! I’m Alex from Parabola (https://parabola.io). Parabola is a visual programming tool for creating functional data flows that everyone can use. It’s entirely drag-and-drop, handles data sizes much larger than a traditional spreadsheet, calculates everything live, and can run your flows on a schedule of your choosing. I used to work in strategy consulting, doing data analytics for SMBs and Fortune 500 companies. The amount of time wasted on menial tasks was astounding. Things like cleaning data, generating custom reports, creating human workflows to solve shortcomings in third…
2018 · parabola.io
- 7PD
2021 · github.com
- 8RL
I've been playing with the idea of an LLM prompt that causes the model to generate and return a new prompt. https://github.com/andyk/recursive_llm The idea I'm starting with is to implement recursion using English as the programming language and GPT as the runtime. It’s kind of like traditional recursion in code, but instead of having a function that calls itself with a different set of arguments, there is a prompt that returns itself with specific parts updated to reflect the new arguments. Here is a prompt for infinitely generating Fibonacci numbers: > You are a…
2023 · github.com
- 9AJ
Here's a project I've been working on for a little while now. Ripl is a JS library that provides a unified API for rendering shapes on both canvas and SVG interchangeably. Over the years I've used D3 extensively to create data visualisations so I figured I'd have a go at making my own version with a slightly more modern API and stricter TypeScript support. I am aware there are already libraries that can draw to multiple contexts interchangeably, but I've added a few little niceties to Ripl that (as far as I know) some other libraries don't have such as CSS-like query selectors, DOM-like…
2024 · github.com
- 10

- 11
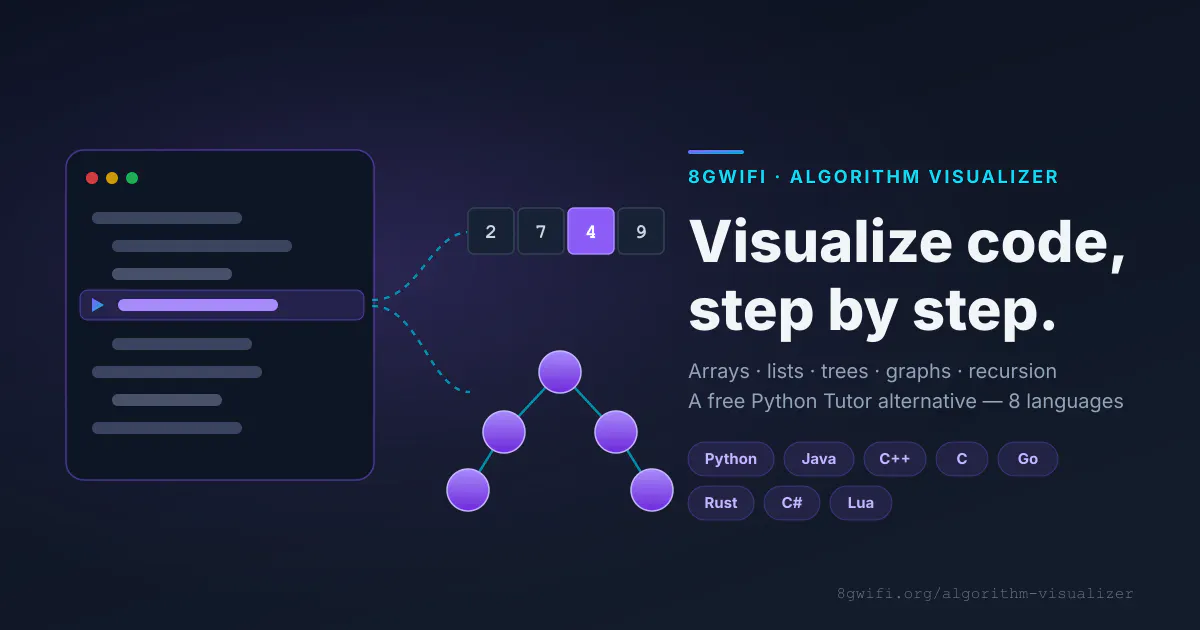
Run 20+ languages online & watch your code execute live
Jul 2026 · 8gwifi.org
- 12

- 13AS
Hi all! A little background: I've been working on natto.dev, a spatial environment for JavaScript. I'm really excited about new interfaces for code (leveraging metaphors we're good at, spatial reasoning, making state visible, design tools, etc). With all the buzz around PyScript, I discovered Pyodide and got it working inside natto. This Python version is a stripped down version of https://natto.dev (eg interactive outputs, multiplayer) so please check that out if this interests you. I'm excited to share this spatial environment for Python. Imagine Jupyter cells arranged on a 2D…
2022 · python.natto.dev
- 14

- 15IC
2024 · github.com
- 16

- 17PR
2023 · elc.github.io
- 18GA
All commands have the format `output = \func inputs` or just `\function inputs`. Points and scalars are built on the fly. Eg `\line a b` to an empty canvas creates points `a` and `b`, and joins them with a line. One can use broadcasting semantics similar to NumPy and PyTorch in a visual setting (imagine creating a list of circles where one dim corresponds to radius and another to the center). One can also use backpropagation, run gradient descent or visualize vector fields. Almost everything is reactive so changing a variable updates all of the downstream geometry. It also allows anyone to…
May 2026 · tinyvolt.com
- 19VP
2021 · github.com
- 20RA
Hi HN, I'm Damien, the solo founder of Recompyle. Self-funded. As a JavaScript developer, I have been annoyed by the console.log not being practical enough, and the debugger being 'too slow'. So I made Recompyle to fix that. It's kind of a mix of the console and the debugger. Plus, some file parsing to automatically log the start of the functions of the files you are working on.
2023 · recompyle.com
- 21SI
Hi All, I would like to share with you a new Python package for interactive decision tree visualization. It is called `supertree`. It visualizes decision tree as interactive graph, where you can collapse and expand selected nodes. You can zoom and pan though large trees. It works with Scikit-learn, Xgboost, and LightGBM. The package works in notebooks: Jupyter Lab, Jupyter Notebook, Google Colab. You can also use it in Python scripts and save output trees to HTML. The package is available on pip: `pip install supertree`. You can find code examples on the GitHub:…
2024
- 22AC
2010 · pyxc.org
- 23

- 24PA
Hello all, Very excited to share this project with you all! Panoptisch scans your Python file or module to find it's imports (aka dependencies) and recursively does so for all dependencies and sub-dependencies. It then generates a dependency tree in JSON for you to parse and enforce import policies. Supply chain attacks are no joke, and this is one way to transparently analyze your dependencies to see if any malicious imports are taking place. For example, your yaml parser, nor it's sub-dependencies should import socket, or sys. Panoptisch is in early stages, with known limitations (for…
2022 · github.com
Ranked by how close each launch is in meaning, then by votes. Refine with a description →