Dev tools · alternatives · 2026

24 alternatives to Statistics for Strava
Self-hosted statistics generated using Strava data
Below are 24 products that do a similar job, ranked by how close each is in meaning and then by launch-day votes.
- 1
 66Analytics▲260
Self-hosted analytics with session replays, heatmaps & more.
2020 · 66analytics.com · its alternatives →
- 2
 HackerMetrics▲322
Turn your Google Analytics into beautiful reports
2017 · hackermetrics.com · its alternatives →
- 3

Get in-product analytics quickly without waiting for sprints
2025 · metabase.com · its alternatives →
- 4
 Git analytics▲131
for software developers, teams, and open-source communities
2019 · its alternatives →
- 5
 Embedful ▲150
Easy data visualizations. Embed and share anywhere.
Mar 2026 · embedful.io · its alternatives →
- 6

- 7
 dataxreports.com▲118
Browse our ready-to-use Google Data Studio templates
2024 · dataxreports.com · its alternatives →
- 8

- 9

2018 · statsbotco.github.io · its alternatives →
- 10

- 11

- 12
- 13

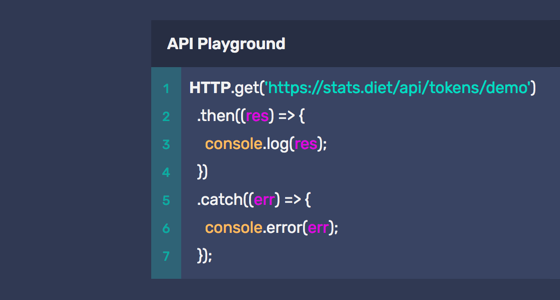
Load your Strava activities into a Postgres instance - davidgomes/strava-postgres
2024 · github.com · its alternatives →
- 14
 Stats-va▲8
An app for you to see your Strava account stats
2024 · play.google.com · its alternatives →
- 15

- 16
 SimpleStats▲143
Discover which channels actually drive revenue, not just traffic. Server-side analytics built for Laravel apps. GDPR compliant, 100% accurate, ad-blocker proof.
2024 · simplestats.io · its alternatives →
- 17
 GitHub Metrics▲157
Customize your profile with various plugins and metrics
2021 · github.com · its alternatives →
- 18

I've been building this for a few years under the name "Statistics for Strava" but I renamed it to Dreeve recently because of Strava's recently changed API usage terms. They paywalled their API. You point it at your activity files (FIT/TCX/GPX) or connect a Strava account, and it gives you a dashboard with segment efforts, gear and maintenance tracking, a heatmap, monthly calendar view, milestones and a year-in-review. It runs as a Docker container, stores everything in SQLite, and nothing leaves your machine. Stack is PHP 8.5 + Symfony, SQLite, Docker Compose. Simple,…
Jul 2026 · github.com · its alternatives →
- 19

Widgets, charts & Sheets for Strava & Garmin runs & rides
2021 · its alternatives →
- 20CD
Hi HN! This is a little site I put together while learning the Elm language as part of a hackathon at my work, I thought you might enjoy it. Be sure to click the `(source)` buttons next to the graphs: you can edit them interactively & write your own queries against the entire data set. The syntax isn't well documented yet, but you can probably get the general idea pretty quickly based on the examples there. If you like it, have questions, etc. let me know! If folks think this is cool, maybe I can get it turned into a legit project. :)
2022 · codestat.dev · its alternatives →
- 21
 BStreams▲62
Interactive, easy, responsive data visualization & analysis
2021 · bstreams.io · its alternatives →
- 22
- 23GR
I built this as part of my quest to properly learn data visualization. The code is the easy part! Some lessons learned: - personal verification of the the general truth that pie charts are tough! and the returns are not great for the effort due to people's difficulties perceiving angles - may not use "vanilla" d3 with no React. was difficult to adapt for mobile - the GitHub API provides fairly standardized responses so building dynamic charts wasn't too bad. But when working with streaming data (say Kafka) I can see this getting interesting... schema registry should help but creating a view…
2024 · see-my-repo.netlify.app · its alternatives →
- 24
Also compare
Ranked by how close each launch is in meaning, then by votes. Prices were read from each product’s own site when checked and can change. Refine with your own description →